ES short term trading 4-26-10
I'm not sure if we want a different thread outside of the Weekend preview for the current day but here it is anyway.
We have daily and weekly R1 levels at the 1224 area which goes well with one of Kools targets and the key number of 1225.
Fridays lows match up well with the weely Pivot and the daily S1 so 1202 -1200 needs to go the radar...another key number.
More current is the O/N low at the 1210 as that was also a low volume area from friday...I'm looking to get that run out today...the 1206 area was the other key breakout point
So far barely a 7 point range in the O/N so will be watching the open in RTH and the midpoint...I'll update later closer to the open...no time spent at 11.75 in the overnight so an obvious first attractor..and it currently sits just below a swing point....I think they will run that out..
I did Paul...The lowest Volume print was 1211.50 - 1211.75.....I may have mentioned it in Kools weekend review.......that's why it was a target this morning...
Hey DT how to edit a topic heading.....multi - tasking today...
Hey DT how to edit a topic heading.....multi - tasking today...
no, Bruce,
from 1705 to 1800 your (central) military time on SUnday, April 25 was smallest volume at price histo for past 2 days (except for tails at top and bottom.
...DId anyone see the PA when ES printed at 5day average of L versus Open? (see earlier post about 1207.50)
from 1705 to 1800 your (central) military time on SUnday, April 25 was smallest volume at price histo for past 2 days (except for tails at top and bottom.
...DId anyone see the PA when ES printed at 5day average of L versus Open? (see earlier post about 1207.50)
Click image for original size
The number I gave out was just the overnight sessiion and what I use in early trade...I didn't run a VAP for friday and the sunday night session combined.....so "your results may vary" ..
YM unable to hold this up so far...
at 1pm the cash markets read like this:
Dow up 32
S&P minus .54
Naz Flat
Theory states that the SP should be up one point for every 8 dow points...so nice divergence there....S&P should have been up 3 points but weakness of S&P pulled it down...nuff said...
AK1 I need a clear explaination of your theory to make it usable
I'm interested in what specifically you saw it the price action once we hit that number....are you refering to bid/ask stuff
Originally posted by PAUL9
no, Bruce,
from 1705 to 1800 your (central) military time on SUnday, April 25 was smallest volume at price histo for past 2 days (except for tails at top and bottom.
...DId anyone see the PA when ES printed at 5day average of L versus Open? (see earlier post about 1207.50)
that 11150 -11140 in the YM is the breakout point in Sundays overnight which we never traded to in the RTH on Monday..I expect that to be filled in in the Monday overnight
bruse,
I was referring to what I had explained, here, on this thread at 11:03 East coast time stamp
"
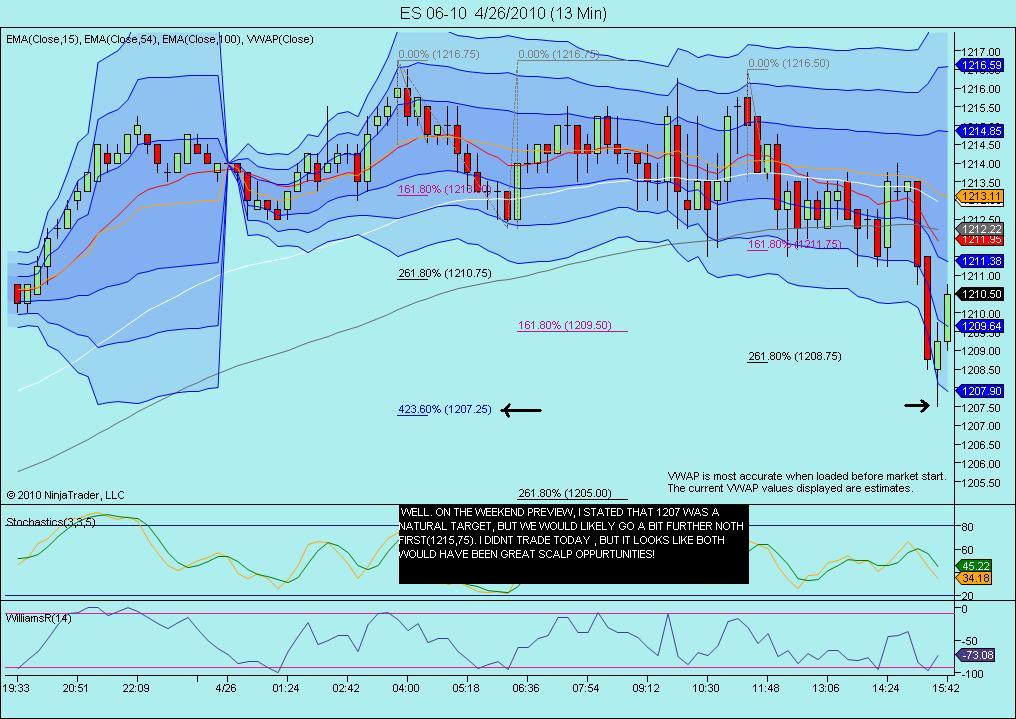
I was interested to see that 1207 was mentioned by someone... 5 day average of L versus Open comes in today at 1207.50. I have noticed that after 2 days of hitting or exceeding (at some point during RTH sessions) the 5 day average of the H versus the open, that the first print at the 5 day average of the L versus the Open is usually good for at least a bounce (if not the beginning of a new leg higher).
"
I was referring to what I had explained, here, on this thread at 11:03 East coast time stamp
"
I was interested to see that 1207 was mentioned by someone... 5 day average of L versus Open comes in today at 1207.50. I have noticed that after 2 days of hitting or exceeding (at some point during RTH sessions) the 5 day average of the H versus the open, that the first print at the 5 day average of the L versus the Open is usually good for at least a bounce (if not the beginning of a new leg higher).
"
You can click on the "reply with quote" in the future so you don't have to cut and paste if that make sit easier for you. It's up near rhe time stamp of the post you want to reference...
Thanks Paul I understand now..
We had the Pivot at 1207.75 which made some cool confluence on many of numbers today..nice projections though
Thanks Paul I understand now..
We had the Pivot at 1207.75 which made some cool confluence on many of numbers today..nice projections though
this will go well as the high volume zone of the es is 1204 - 1205......from all of last weeks trade
Originally posted by BruceM
that 11150 -11140 in the YM is the breakout point in Sundays overnight which we never traded to in the RTH on Monday..I expect that to be filled in in the Monday overnight
Originally posted by BruceM
...Hey DT how to edit a topic heading.....multi - tasking today...
Fixed the heading - sorry it took me so long to get to...
Emini Day Trading /
Daily Notes /
Forecast /
Economic Events /
Search /
Terms and Conditions /
Disclaimer /
Books /
Online Books /
Site Map /
Contact /
Privacy Policy /
Links /
About /
Day Trading Forum /
Investment Calculators /
Pivot Point Calculator /
Market Profile Generator /
Fibonacci Calculator /
Mailing List /
Advertise Here /
Articles /
Financial Terms /
Brokers /
Software /
Holidays /
Stock Split Calendar /
Mortgage Calculator /
Donate
Copyright © 2004-2023, MyPivots. All rights reserved.
Copyright © 2004-2023, MyPivots. All rights reserved.