ES Short Term Trading 5/5/10
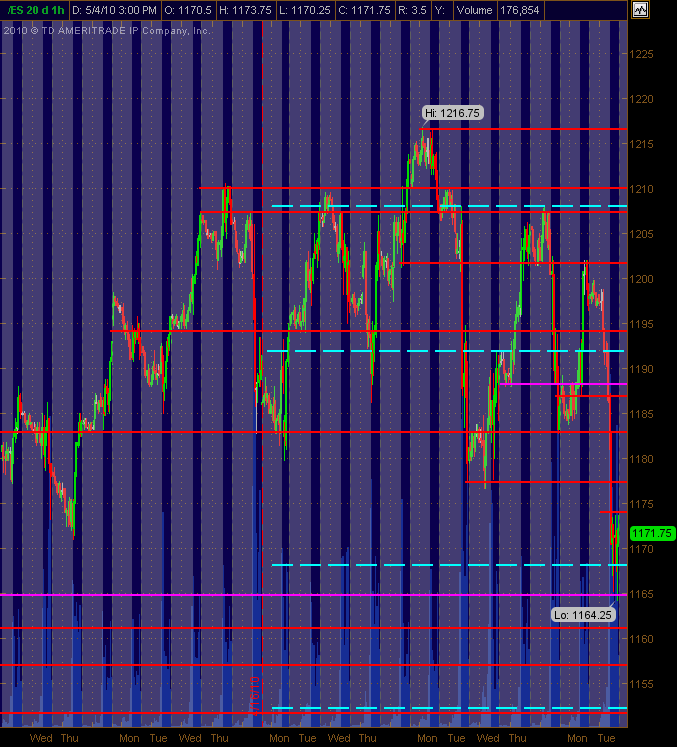
Have adjusted PASR lines that I see for potential support and/or resistance in Red with Magenta as "semi-significant" ... the Cyan dashed lines are the Weekly Pivot levels on the 30m chart that shows 24 hour trading with the gray background areas being overnight trading. Hope they're helpful as a map for Wednesday's trading.
Click image for original size
Click image for original size
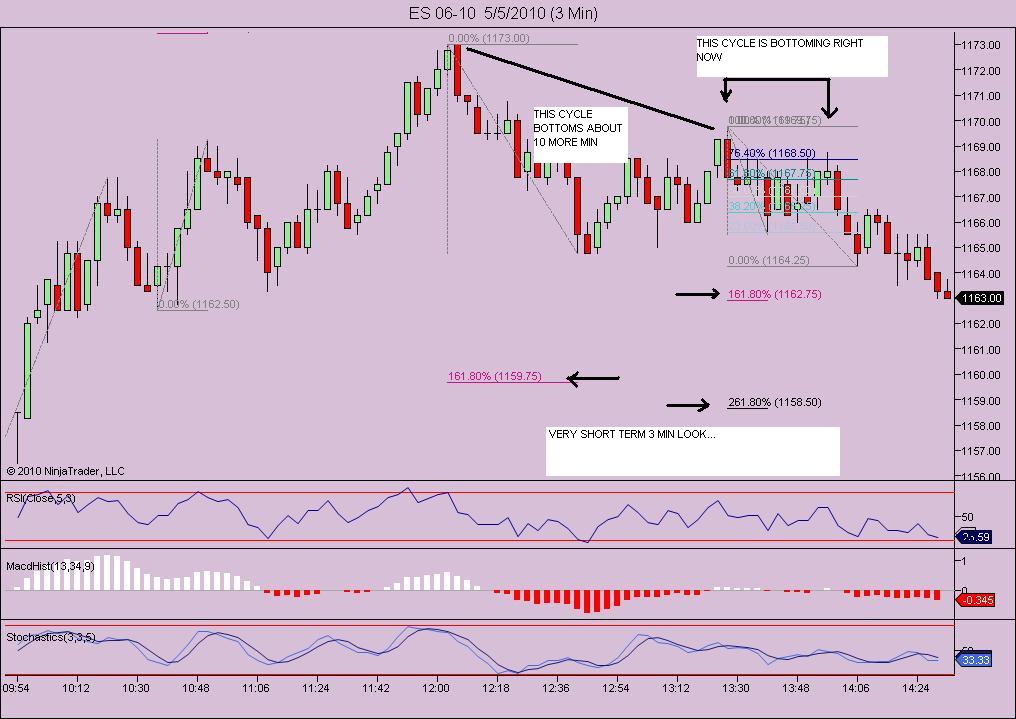
Stopped at 1161.25, loss of 2.75 on one es.. will buy 2 1158.50-1159.50 (which was the higher odds play)
The 59.75- 60 was a number that had little time this morning...tought it would hit much earlier then now....but then again I also thought we'd see 75 - 77..
Air at 1163
Long at 1159 exit 1163
well, i didnt trade earlier today.. too many errands.. but i think i also had 1176 as a possible target.anyway im trying a long here from 1159.00
It really appears they still want lower and as you know im looking for the bottom tomorrow around 1151-1153. Time will tell!.will bail on this trade at 1160.50 if i can get it!... JUST FILLED!!
Went 3 pts but I want 4 so lets see
Good luck, AK! The real fun should start tomorrow! See ya all then!
Beautiful got it finally
13:45:36 1 BUY_LIMIT 1159.00
14:24:44 1 SELL_LIMIT 1163.00
13:45:36 1 BUY_LIMIT 1159.00
14:24:44 1 SELL_LIMIT 1163.00
you got a bad attitude man ! Call it what you like!!
Originally posted by ak1
Originally posted by BruceM
can you get us a visual on your air concept..I don't see it....perhaps we need to call it AK1 air so we don't confuse folks...Originally posted by ak1
Air at 1163
I like the name. Thanks. I can't give the visual as you need to watch a 30 min chart to catch it. It occures at the high and low of a recent 30 min candle. When we hit these levels we must go back 2 ticks. If we do not then we have air. I usually let this run for 4 points and then enter hoping to fill the air.
Emini Day Trading /
Daily Notes /
Forecast /
Economic Events /
Search /
Terms and Conditions /
Disclaimer /
Books /
Online Books /
Site Map /
Contact /
Privacy Policy /
Links /
About /
Day Trading Forum /
Investment Calculators /
Pivot Point Calculator /
Market Profile Generator /
Fibonacci Calculator /
Mailing List /
Advertise Here /
Articles /
Financial Terms /
Brokers /
Software /
Holidays /
Stock Split Calendar /
Mortgage Calculator /
Donate
Copyright © 2004-2023, MyPivots. All rights reserved.
Copyright © 2004-2023, MyPivots. All rights reserved.