ES Short Term Trading 5/5/10
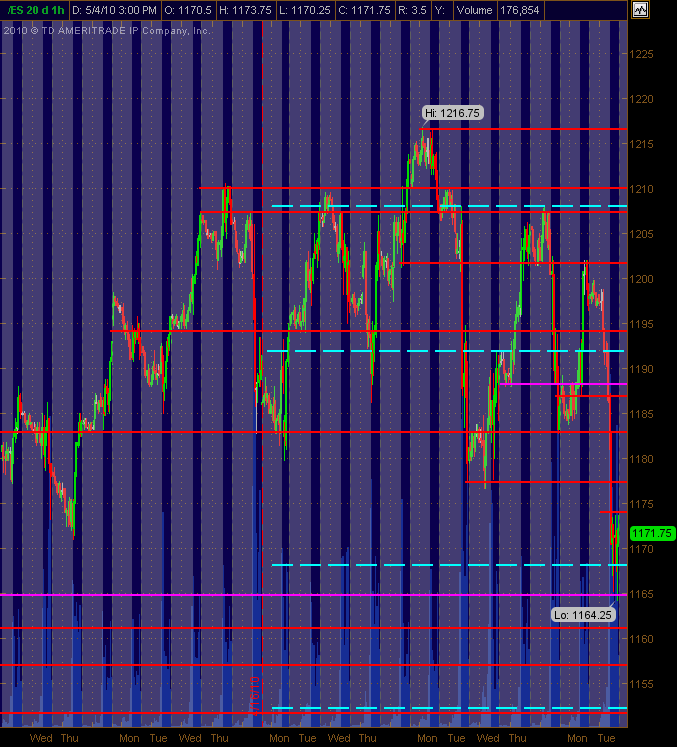
Have adjusted PASR lines that I see for potential support and/or resistance in Red with Magenta as "semi-significant" ... the Cyan dashed lines are the Weekly Pivot levels on the 30m chart that shows 24 hour trading with the gray background areas being overnight trading. Hope they're helpful as a map for Wednesday's trading.
Click image for original size
69 - 70 ..that was peak in O/N too.....interesting spot...failure now will go test 65.50 as no time spent there today....yet!!!..
Originally posted by koolblue
Click image for original size
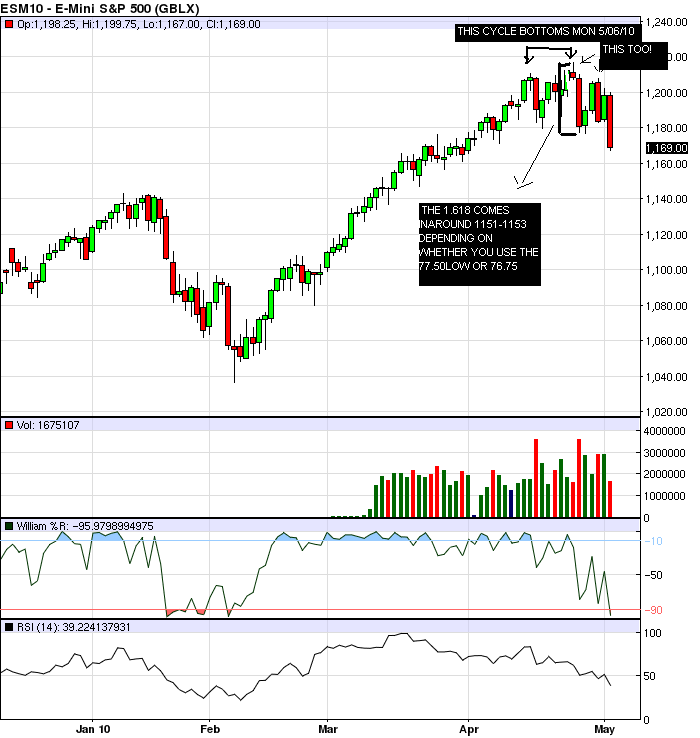
Fascinating..... This is fast becoming a deja vu copy of Feb 4/5 turning point.
Massive down day: yesterday's range was 35.5 pts
next day reversal: today is looking more and more like a reversal day.
adjusted targets...took 69 and adjust 2nd down to 74. if 74 is hit, might look for a re-entry long around 68.
i agree w/ you phileo. this is not what i expected....and since its so different then what i expected i reversed my thoughts now just going to ride it and see. i can't lose money now.
Originally posted by TraderF
not my usual type entry. but i got long at 62.75. looked like a lot of strength when it hit that 57. so i figured wait for a small retracement when it hit the moving avg.
it really popped out of that area. i'm following closely but 1st target is gap fill. 2nd is 77
what kind of moving.avg are you using, intraday or daily? how many bars?
Originally posted by BruceM
69 - 70 ..that was peak in O/N too.....interesting spot...failure now will go test 65.50 as no time spent there today....yet!!!..
that run-up from 1162.75 stopped dead in its tracks at 1169.25.... whoever said mkts are random ???
Good entry TraderF on the 1162.75 long; I hesitated for a second, and it literally ran away from me....
Originally posted by phileo
Originally posted by TraderF
not my usual type entry. but i got long at 62.75. looked like a lot of strength when it hit that 57. so i figured wait for a small retracement when it hit the moving avg.
it really popped out of that area. i'm following closely but 1st target is gap fill. 2nd is 77
what kind of moving.avg are you using, intraday or daily? how many bars?
that one is a 50ema on a 13k tick chart on a continuous contract. so not intraday or daily.
perfect...the markets are so efficient..we gotta respect that.....we'll let the trend traders have there one or two days a month like yesterday but we know better....
After a challenging trend day like yesterday I always say to myself.....
"that's ok it's only money I can make more"
After 10 years I still have a long way to go as I want to trade bigger so I'm certainly not implying I'm the worlds greatest trader...
A humble belief in yourself and your numbers without arrogance is the goal...and of course....pay it forward..!!
Stops still sit below 62.50 for those holding this short....
Originally posted by BruceM
69 - 70 ..that was peak in O/N too.....interesting spot...failure now will go test 65.50 as no time spent there today....yet!!!..
Originally posted by phileo
Originally posted by BruceM
69 - 70 ..that was peak in O/N too.....interesting spot...failure now will go test 65.50 as no time spent there today....yet!!!..
that run-up from 1162.75 stopped dead in its tracks at 1169.25.... whoever said mkts are random ???
Good entry TraderF on the 1162.75 long; I hesitated for a second, and it literally ran away from me....
thanks. tough for me to swallow, but the risk reward if it worked was nice if it works out....i will be challenged to remember one that worked out like that. usually after large drops it puts multiple test on the lows before breaking back above the moving averages.
As i right this it doesn't look like it will totally work out but i made money on it. on my charts it didn't break above the MA. maybe i should have followed what i said this morning....about shorting in that area.
who knows though....today is acting weird.
it's never good when an hour high breakout runs into a key zone and gets back below the hour high...these $ticks are really bad today..I just don't see a lasting rally coming from these...
so the new battle at the 64 volume will help light the way...the buyers off it will look for new highs if they can...I'm mot convinced and not ruling out the 59.75 es and nq at 1945
so the new battle at the 64 volume will help light the way...the buyers off it will look for new highs if they can...I'm mot convinced and not ruling out the 59.75 es and nq at 1945
you got a bad attitude man ! Call it what you like!!
Originally posted by ak1
Originally posted by BruceM
can you get us a visual on your air concept..I don't see it....perhaps we need to call it AK1 air so we don't confuse folks...Originally posted by ak1
Air at 1163
I like the name. Thanks. I can't give the visual as you need to watch a 30 min chart to catch it. It occures at the high and low of a recent 30 min candle. When we hit these levels we must go back 2 ticks. If we do not then we have air. I usually let this run for 4 points and then enter hoping to fill the air.
Emini Day Trading /
Daily Notes /
Forecast /
Economic Events /
Search /
Terms and Conditions /
Disclaimer /
Books /
Online Books /
Site Map /
Contact /
Privacy Policy /
Links /
About /
Day Trading Forum /
Investment Calculators /
Pivot Point Calculator /
Market Profile Generator /
Fibonacci Calculator /
Mailing List /
Advertise Here /
Articles /
Financial Terms /
Brokers /
Software /
Holidays /
Stock Split Calendar /
Mortgage Calculator /
Donate
Copyright © 2004-2023, MyPivots. All rights reserved.
Copyright © 2004-2023, MyPivots. All rights reserved.