ES short term trading 5-13-10
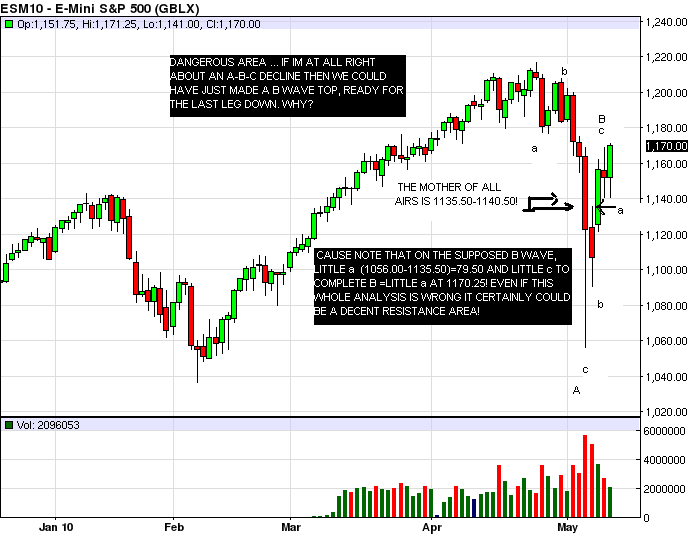
Impressive rally so far after an even more impressive decline last week! I think i should clarify my views on something. As i have been posting , im of the opinion that new yearly highs lie ahead.Most bloggers have still not quite embraced that view yet(they will!..lol). But i have also said that the decline is not over yet. Remember as it was happening i declared that this is what a capitulation bottom looks like? (refer to posts on crash day 5-6-10) . That would likely be the price low.(most bloggers have now begun to adopt that opinion) . I just feel the 'form' of the decline need one more leg down, likely into the 19th or 24th (refer to Kools calendar). In other words the price was ok, but the market may need more decline in terms of time.Any way , thats my opinion, right or wrong, for purposes of clarification. So the question for me is .. are we ready for that last leg down yet? If its going to happen at all, i mentioned days ago ,it would be most likely from this area,or the .886 retrace zone around 1183(which is a daily projection). Of course i could be completely wrong on all of this , but currently its my overriding bias. Time will tell!
Click image for original size
Click image for original size
Here's a 1hr, 30 day chart of the ES showing overnight trading in the grayed areas. Still learning how to navigate and employ tools from Thinkorswim ... and have added a vertical Volume Profile on the chart.
The Red lines are signif potential S/R levels with Magenta being semi-significant and the dashed Cyan lines are Wkly Pivot lines. Two areas currently above the market are off-white zones of roughly 3 points ... 1175-1178 and 1207-1210.
So, here's the chart:
The Red lines are signif potential S/R levels with Magenta being semi-significant and the dashed Cyan lines are Wkly Pivot lines. Two areas currently above the market are off-white zones of roughly 3 points ... 1175-1178 and 1207-1210.
So, here's the chart:
Click image for original size
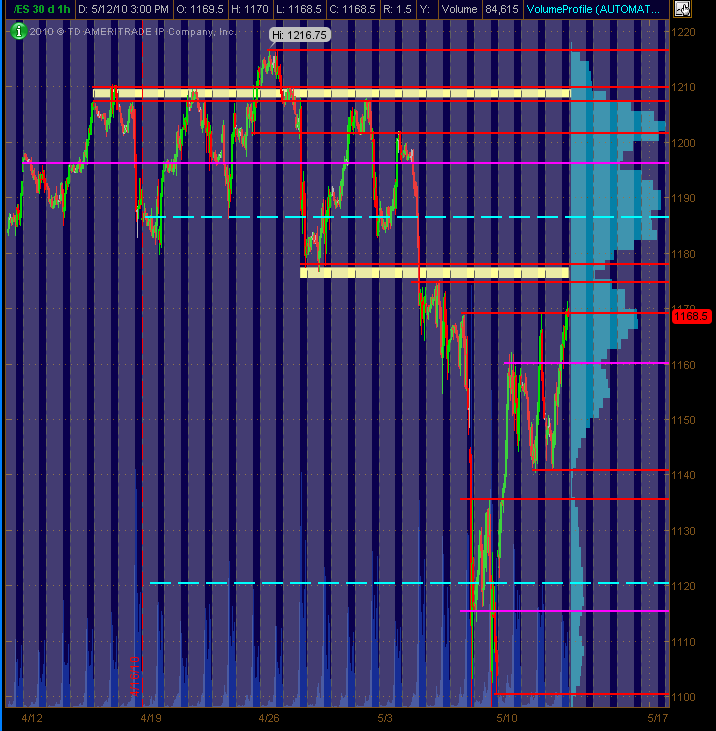
Market full of persistent buyers today w/a nice intraday trend. Mkt. currently trading @ 1168 as of this post .. and I'm bullish.
1175-1178 zone seems significant potential resistance, but I'm gonna be looking at price action if/when it gets there due to the bullishness of the recent mkt activity ... btw, also, Daily R1 is 1180 fyi
1187/1191 is next potential signif resist area (yeah, wide zone, I know, ugh) and Daily R2 is 1191 ... so overall 1190 area seems pretty important to my eyes if price gets up there
1160 below the current market still looks good as a decent support level based on price action over the past several days ... and also 1160 is the Daily Mid Pivot
Just another note ... I've got the 50 day sma at apprx. 1170-71, which was today's high ... hmmm?
Hope this is a helpful map that anyone can dovetail into their own trading analysis. And if my "new" vertical volume thingy is "off" ... fill me in please.
Jeeeez ... was watching American Idol (for the first full season for me) and KNEW they were gonna boot Casey ... a bro from nearby in Texas. But they jettisoned Big Mike. I called Crystal as the winner when there were over 40 gals and as many guys early on! She better win with Lee coming second. So, if any market analysis and commentary above don't make sense ... it was due to posting while watching the show.
yeah, i'm short the American Idols ratings. That show blows!
yeah me too...key number at 75 and 3rd band of Vwap....so 73.75 it is...I gotta sleep
71.75 filled in the air pocket....so we gotta take something incase buyers step back in....
I have big magnet at 65 today from Wednesdays session it's peak volume and Vwap.....
I have big magnet at 65 today from Wednesdays session it's peak volume and Vwap.....
Click image for original size
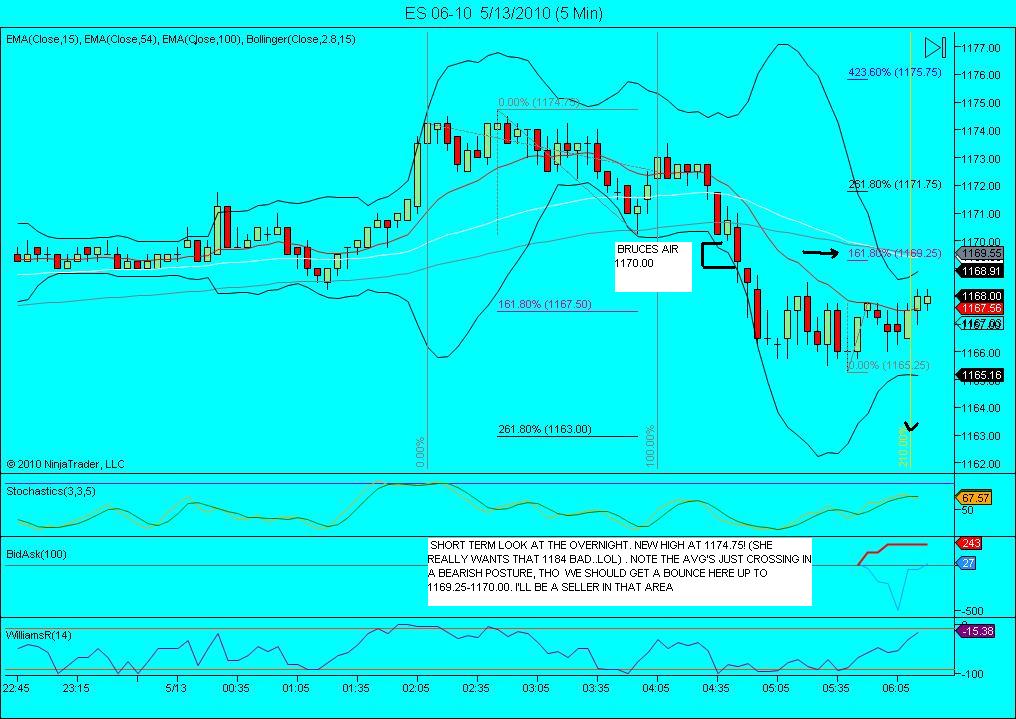
PRC has not issued a sell here, but im short one at 1169.25...
Originally posted by prestwickdrive
Using Kools Tools, move from 69.75 to 66.0 projects 60.0
Next projection based on 69.75-65.0 projects 57.25 then 69.75-62.75 projects 51.5. carry over pitsingle ticks 56.0-59.25 filling.
Emini Day Trading /
Daily Notes /
Forecast /
Economic Events /
Search /
Terms and Conditions /
Disclaimer /
Books /
Online Books /
Site Map /
Contact /
Privacy Policy /
Links /
About /
Day Trading Forum /
Investment Calculators /
Pivot Point Calculator /
Market Profile Generator /
Fibonacci Calculator /
Mailing List /
Advertise Here /
Articles /
Financial Terms /
Brokers /
Software /
Holidays /
Stock Split Calendar /
Mortgage Calculator /
Donate
Copyright © 2004-2023, MyPivots. All rights reserved.
Copyright © 2004-2023, MyPivots. All rights reserved.