ES Short Term Trading 5-21-10
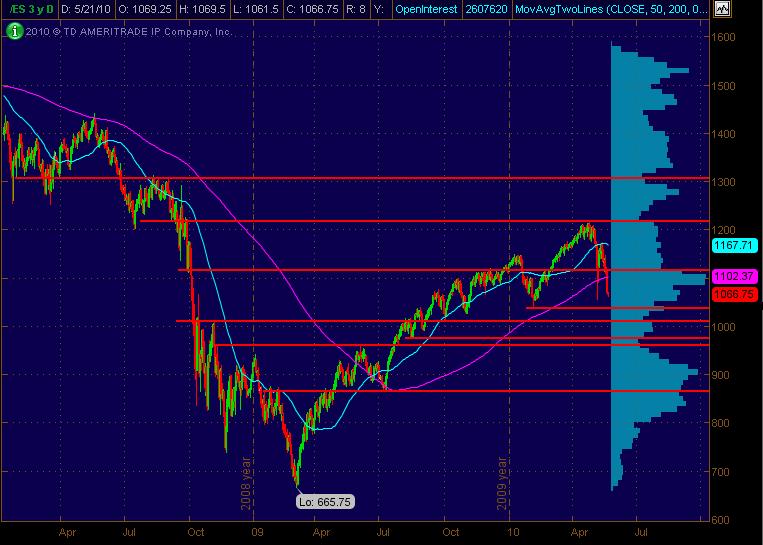
With the mkt getting so volatile and funkadelic, thought I'd just go to the big picture with a Daily chart showing the 50 and 200 day sma's along with what I'm seeing as significant Price Action S/R levels in Red. The chart is a 3-year Daily (Continuous Contract) chart including a Volume Profile.
Don't really see a pattern of classical or more recent origin other than a potential forming of a Head and Shoulders ... potentially a "Rolling" H&S. For the short and even intermediate term (almost), the mkt is "oversold" ... whatever that truly means.
But since the Flash Crash and all the subsequent volatility and erratic price movement, it's even more challenging with Op-Ex Friday. I still think that MP has been describing the market the best, especially as translated by BRUCE!
Don't forget to also track intraday the NQ and YM, looking at relative strength or weakness compared to the ES. Others have commented on NQ being a leading/early-warning of where the ES might travel during the trading session.
So here's the chart. Fyi, I trade stocks mostly and this functions as a market map for me ... which is also why I don't post much intraday unless I'm more focused on and TRADING the ES.
Click image for original size
holding that 62.50 went up 6.25 more for 68.75...I'm flat at 69.75...trying to find shorts...need to see it get below 68.75 again...
I would think that everyone is good and long now.....air below....they may try to push the 81.25 number..and no 15 minute test ..YET...bias is short above the 75 with that last air pocket close
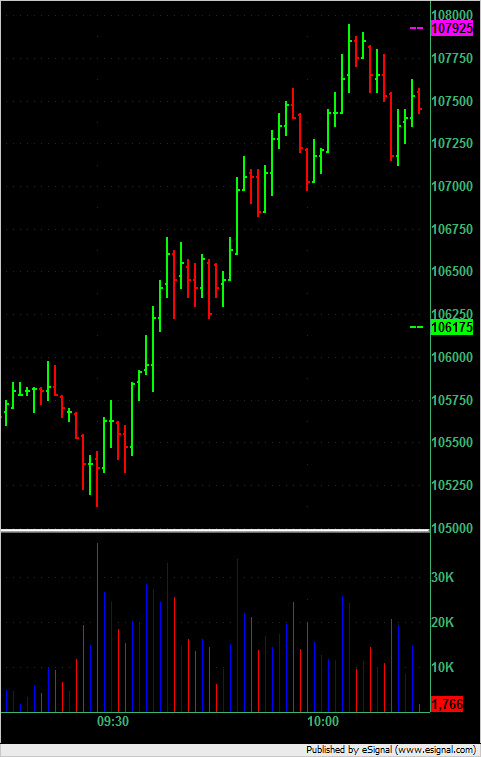
Chances of a long strong trend day up are less than one going down - in general. However, looking strong in the upward direction now. 45 minutes in and 25 handle range. We had 20 handles in first 20 minutes today.
Chart is 1 minute ES. Two markers on right hand side are developing value areas; high is pink and low is green/lime.
Chart is 1 minute ES. Two markers on right hand side are developing value areas; high is pink and low is green/lime.
Click image for original size
got 70 and now runner strying for 15 minute high and air
just some internals fyi ... as of 09:16:00 NASDAQ mkt Vol very heavy for this time of day, typical of Op-Ex. Breadth bearish w/ 1150 Advancing Issues vs. 1305 Declining issues = ratio of 0.9 to 1. Adv. Vol is 130M / Decl. Vol is 509M, a 0.3 to 1 ratio ... New 52 Wk highs is 2 and 52 Wk lows is 121
NYSE also heavy vol with bearish breadth ... Adv Issues 1264 / Decl Issues 1630, a ratio of 0.8 to 1. Adv Vol 84M / Decl Vol 539M, a ratio of 0.2 to 1 ... New 52 Wk highs 18 / lows 137
CBOE VIX down 3.29 to 42.50
... just some additional info fwiw
NYSE also heavy vol with bearish breadth ... Adv Issues 1264 / Decl Issues 1630, a ratio of 0.8 to 1. Adv Vol 84M / Decl Vol 539M, a ratio of 0.2 to 1 ... New 52 Wk highs 18 / lows 137
CBOE VIX down 3.29 to 42.50
... just some additional info fwiw
got the 15 minute high...descision time...looking for 62.50 ...two left...71.25 stops them out
failure at 75 will target 68.75 and lower now
They didn't quite take out the O/N high of 80.50 ... although roughly a 50% Rtc of RTH off current high of session and ooching back up now.
I'd originally expected a gap down go long day (well beyond 1080) ... may still unfold, but looking kinda "rangey" for now at this point.
Still long bias and looking for a retest of RTH high of 79.50 and at least a flush above 80.50 O/N high.
Think there's money on both sides of the market today, long and short.
Originally posted by BruceM
failure at 75 will target 68.75 and lower now
Good call!
No kidding ... Bruce, you've been nailing (and describing) some really good calls during such a volatile mkt!
Originally posted by day trading
Originally posted by BruceM
failure at 75 will target 68.75 and lower now
Good call!
Originally posted by feng456
Guys what is a good way (maybe tried and tested personal experience?) of raising one's confidence?
Feng, I tried to answer your question here:
http://www.mypivots.com/Board/Topic/5713/1/how-to-build-confidence
I thought it would be better as its own thread, so as not to hijack this one, and to have it where more people would read it.
Emini Day Trading /
Daily Notes /
Forecast /
Economic Events /
Search /
Terms and Conditions /
Disclaimer /
Books /
Online Books /
Site Map /
Contact /
Privacy Policy /
Links /
About /
Day Trading Forum /
Investment Calculators /
Pivot Point Calculator /
Market Profile Generator /
Fibonacci Calculator /
Mailing List /
Advertise Here /
Articles /
Financial Terms /
Brokers /
Software /
Holidays /
Stock Split Calendar /
Mortgage Calculator /
Donate
Copyright © 2004-2023, MyPivots. All rights reserved.
Copyright © 2004-2023, MyPivots. All rights reserved.