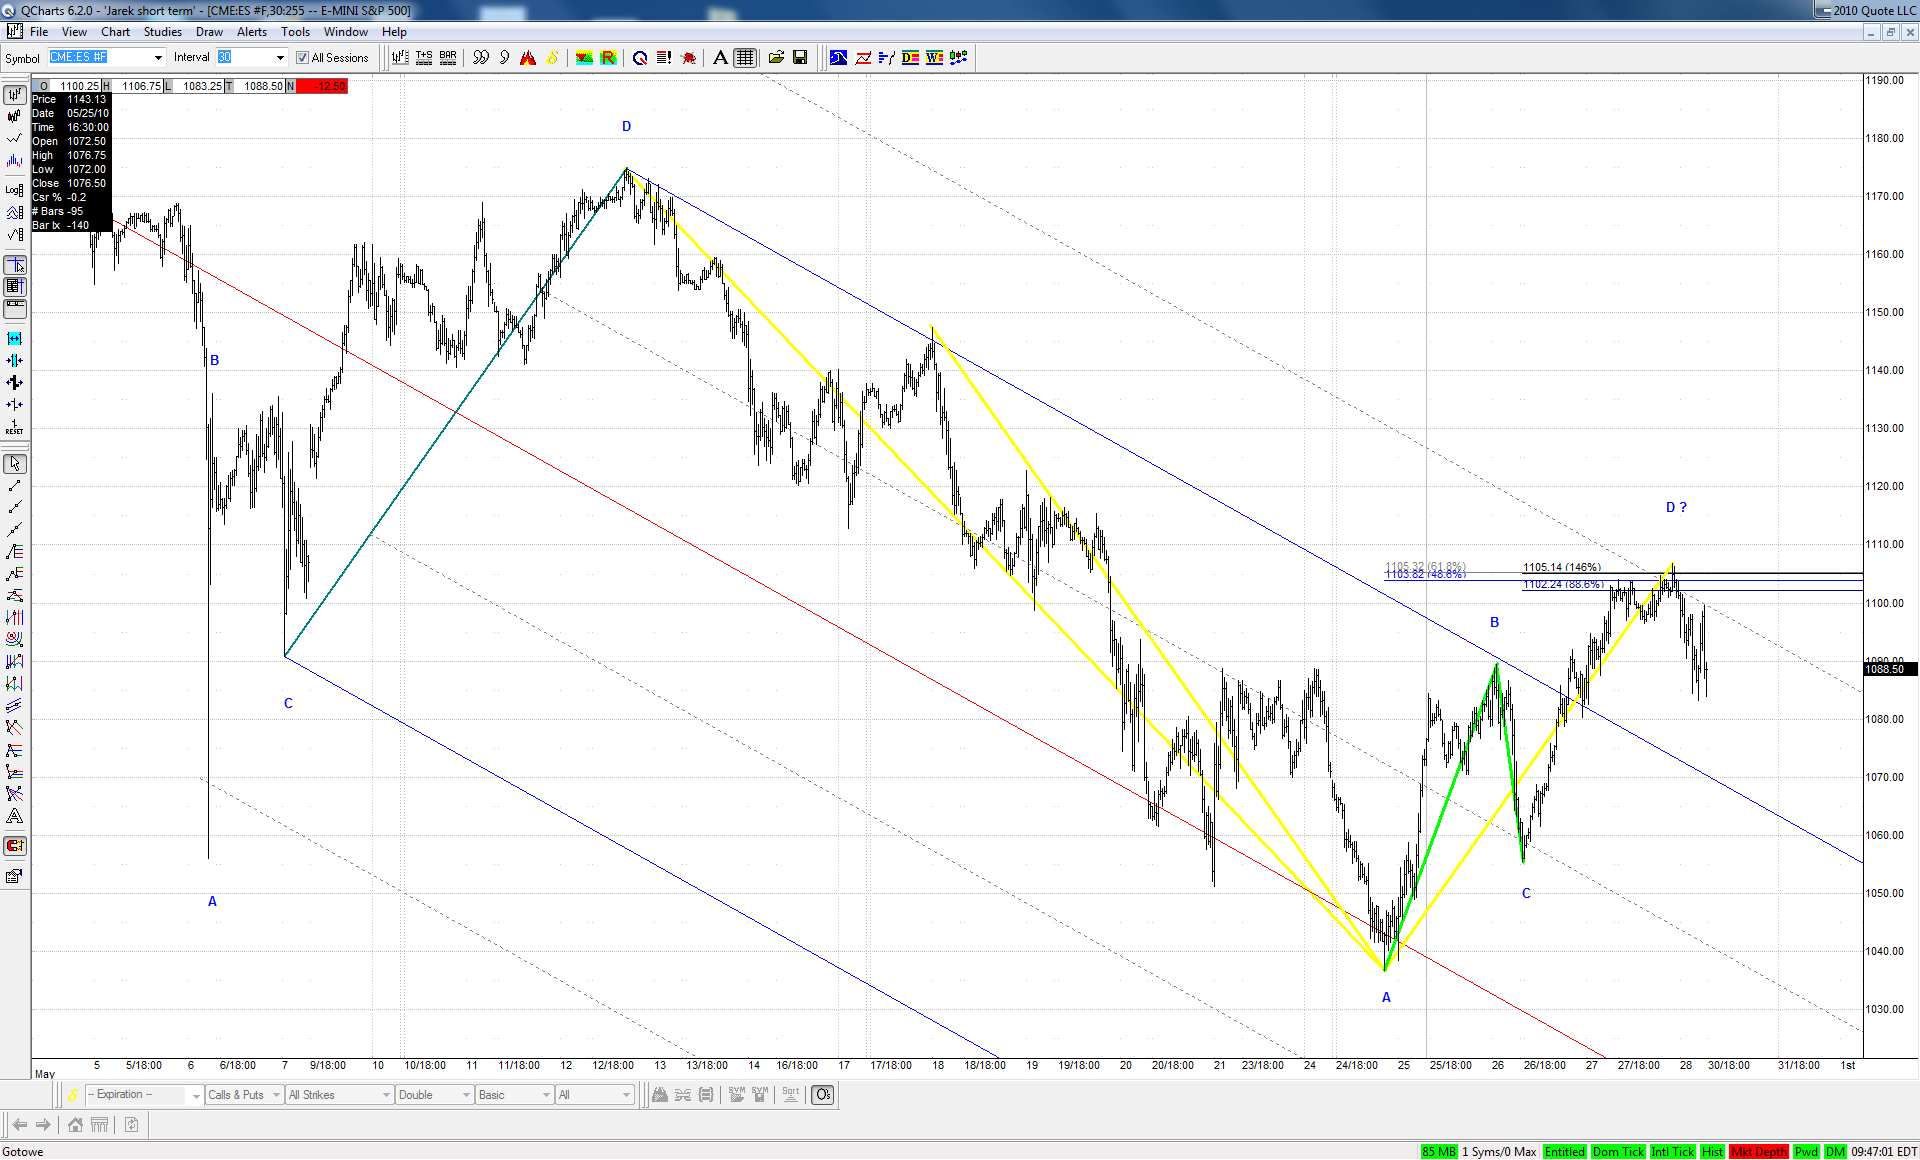
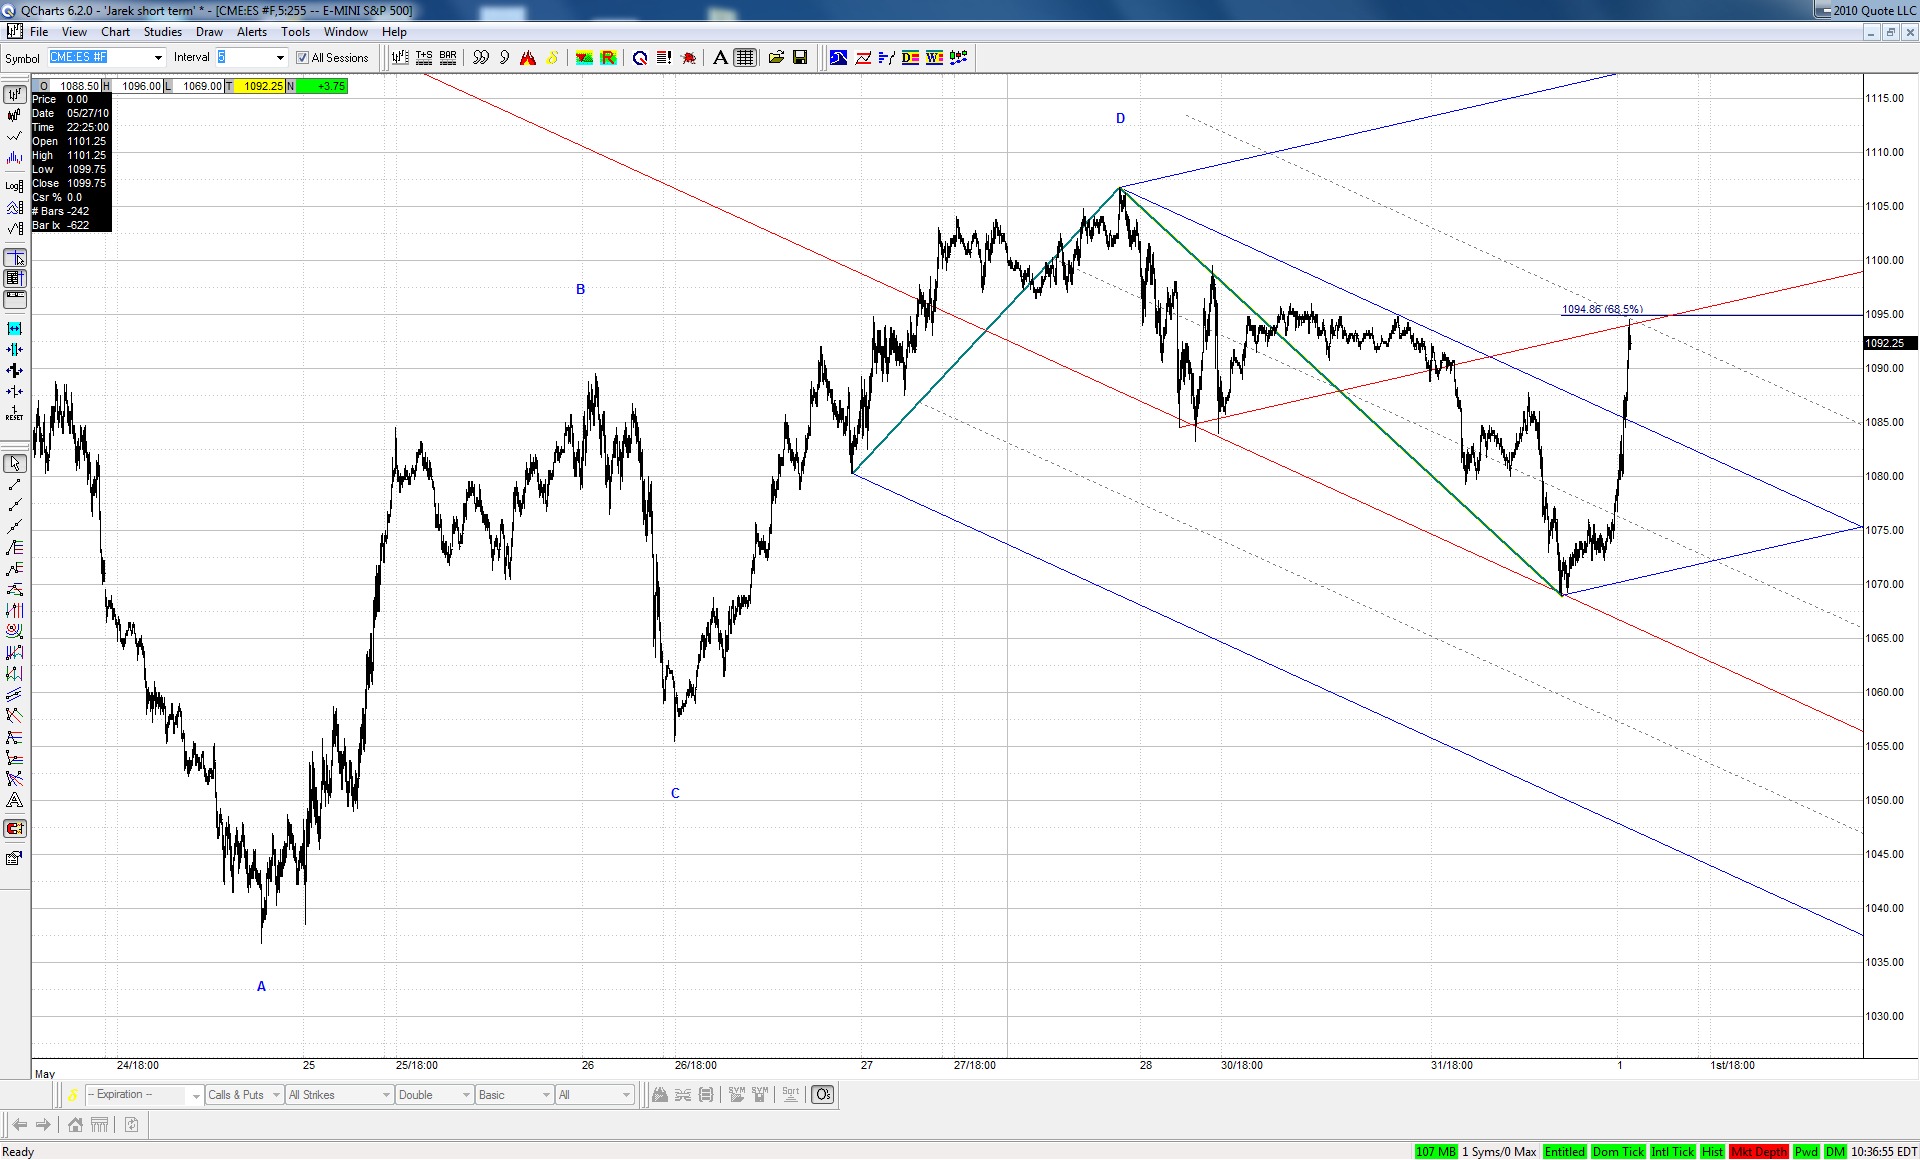
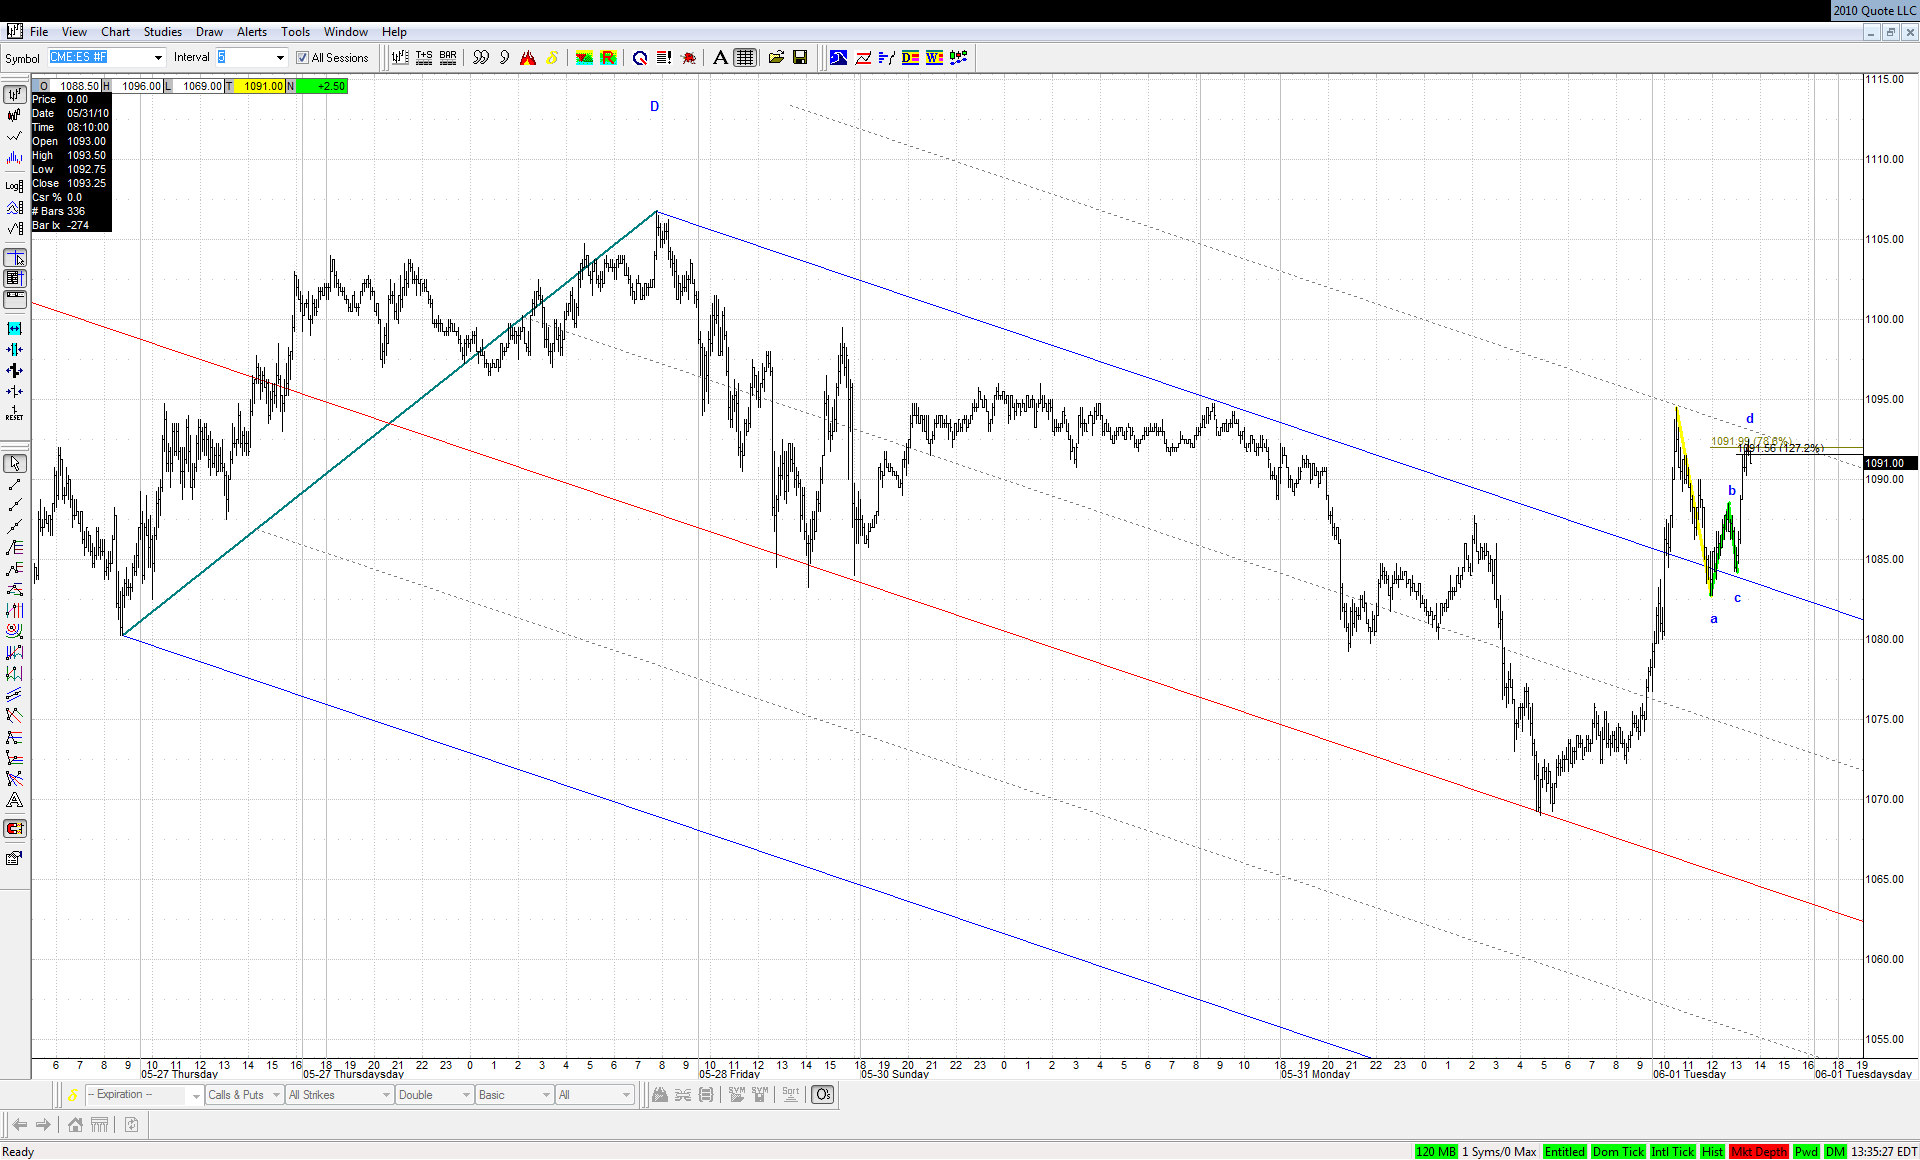
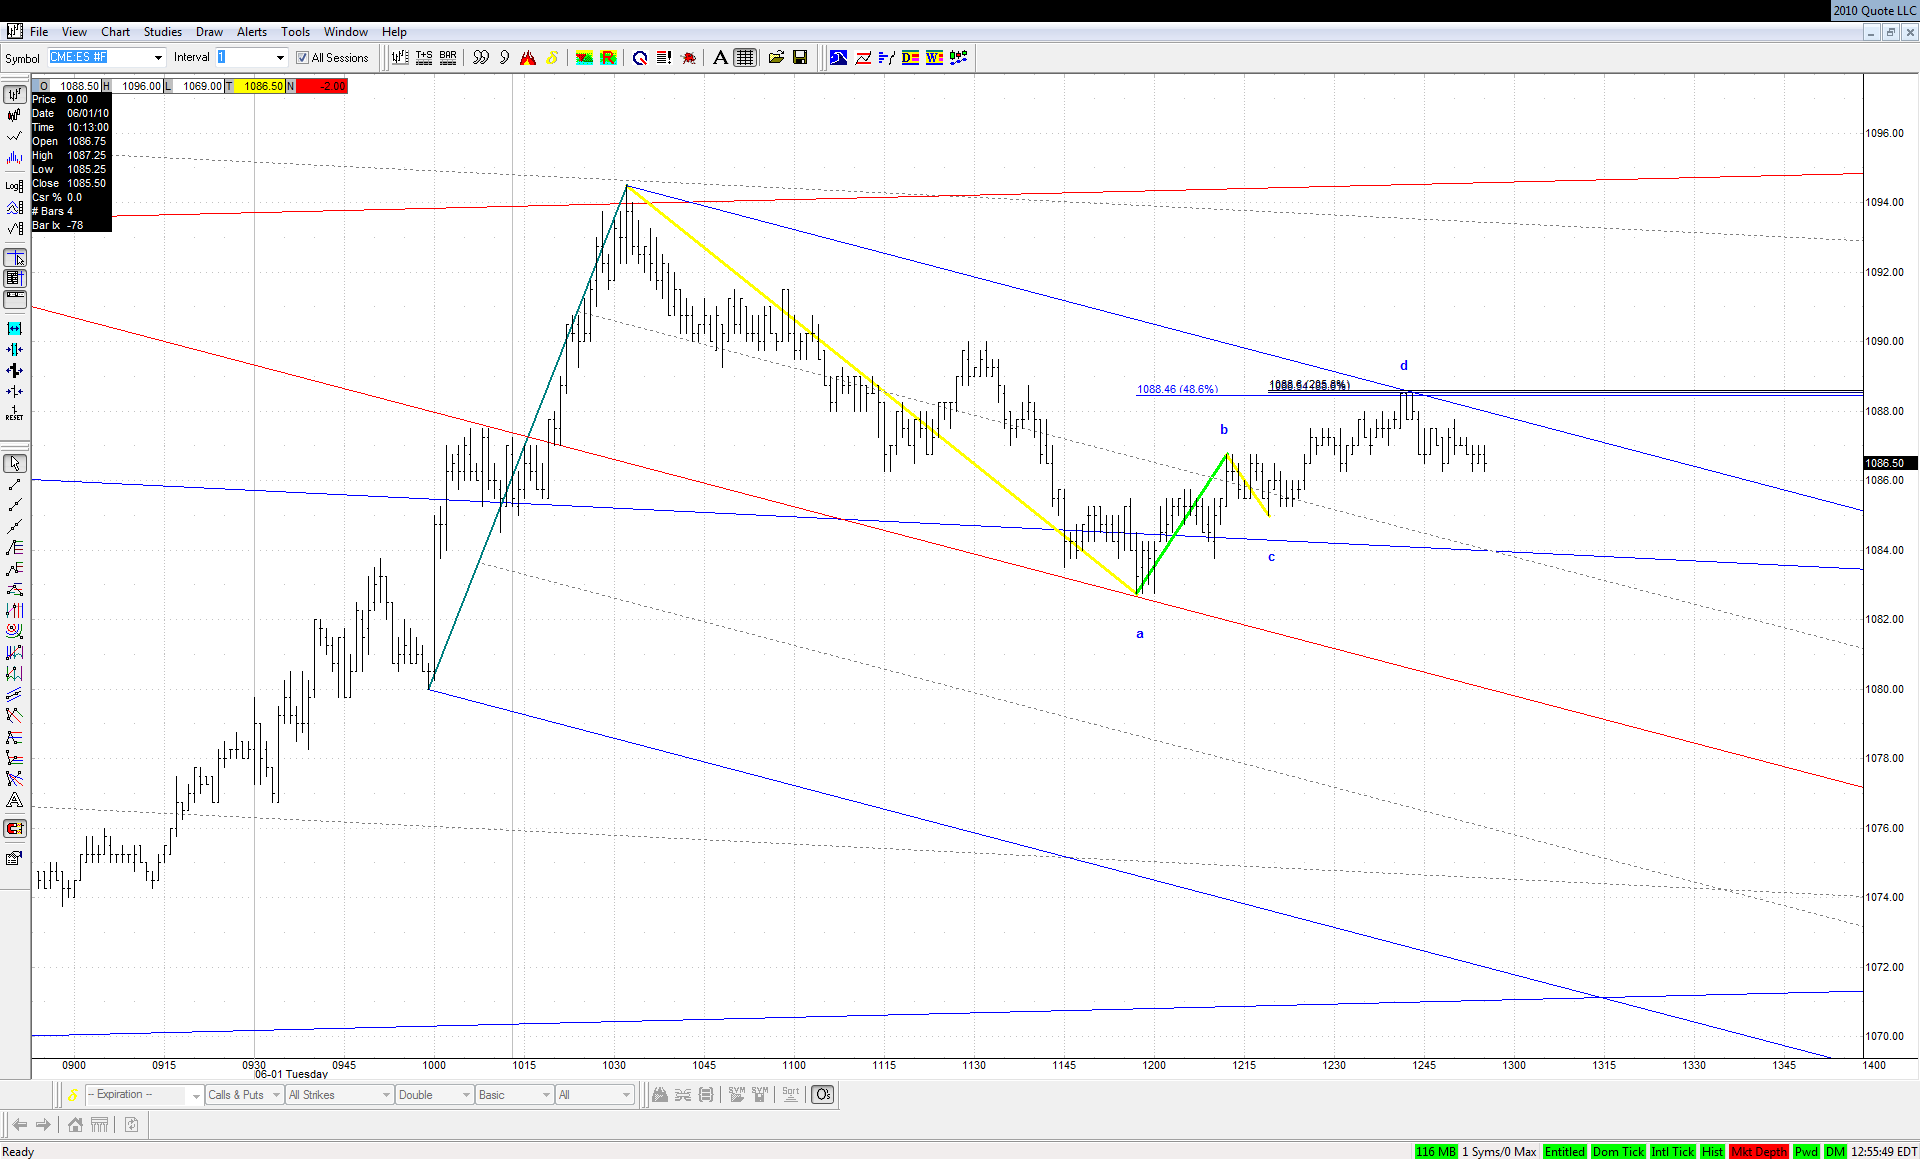
I continue to believe that the move down off our big bearish Kane ABCD isn't finished yet because it hasn't reached 1.272 external retracement of that ABCD. Therefore I still look for a potential W4 correction of that move in the form of a sharp zigzag. My downsloping warning line was breached on Friday but there is a downsloping set suggesting that Friday's high could have marked the end of such zigzag. There was a clear retest of the line before the end of the session so it looks quite interesting:
JI
jimkane
Rep: 3,058
Posts: 33,089
Nice work, jarek. I agree 100% with this potential layout. The main issue I have is here:
http://www.zerohedge.com/article/investor-sentiment-fat-pitch
The sentiment may imply 'up' for awhile. On the other hand, sentiment, like an indicator, can get more 'overbought' or 'oversold', and that may happen at the bigger ABCD bounce spot down lower that we are looking at. Then it bounces, clears out the bearish sentiment, and perhaps rolls as a 'W3' manifests. Just some thoughts.
JI
jimkane
Rep: 3,058
Posts: 33,089
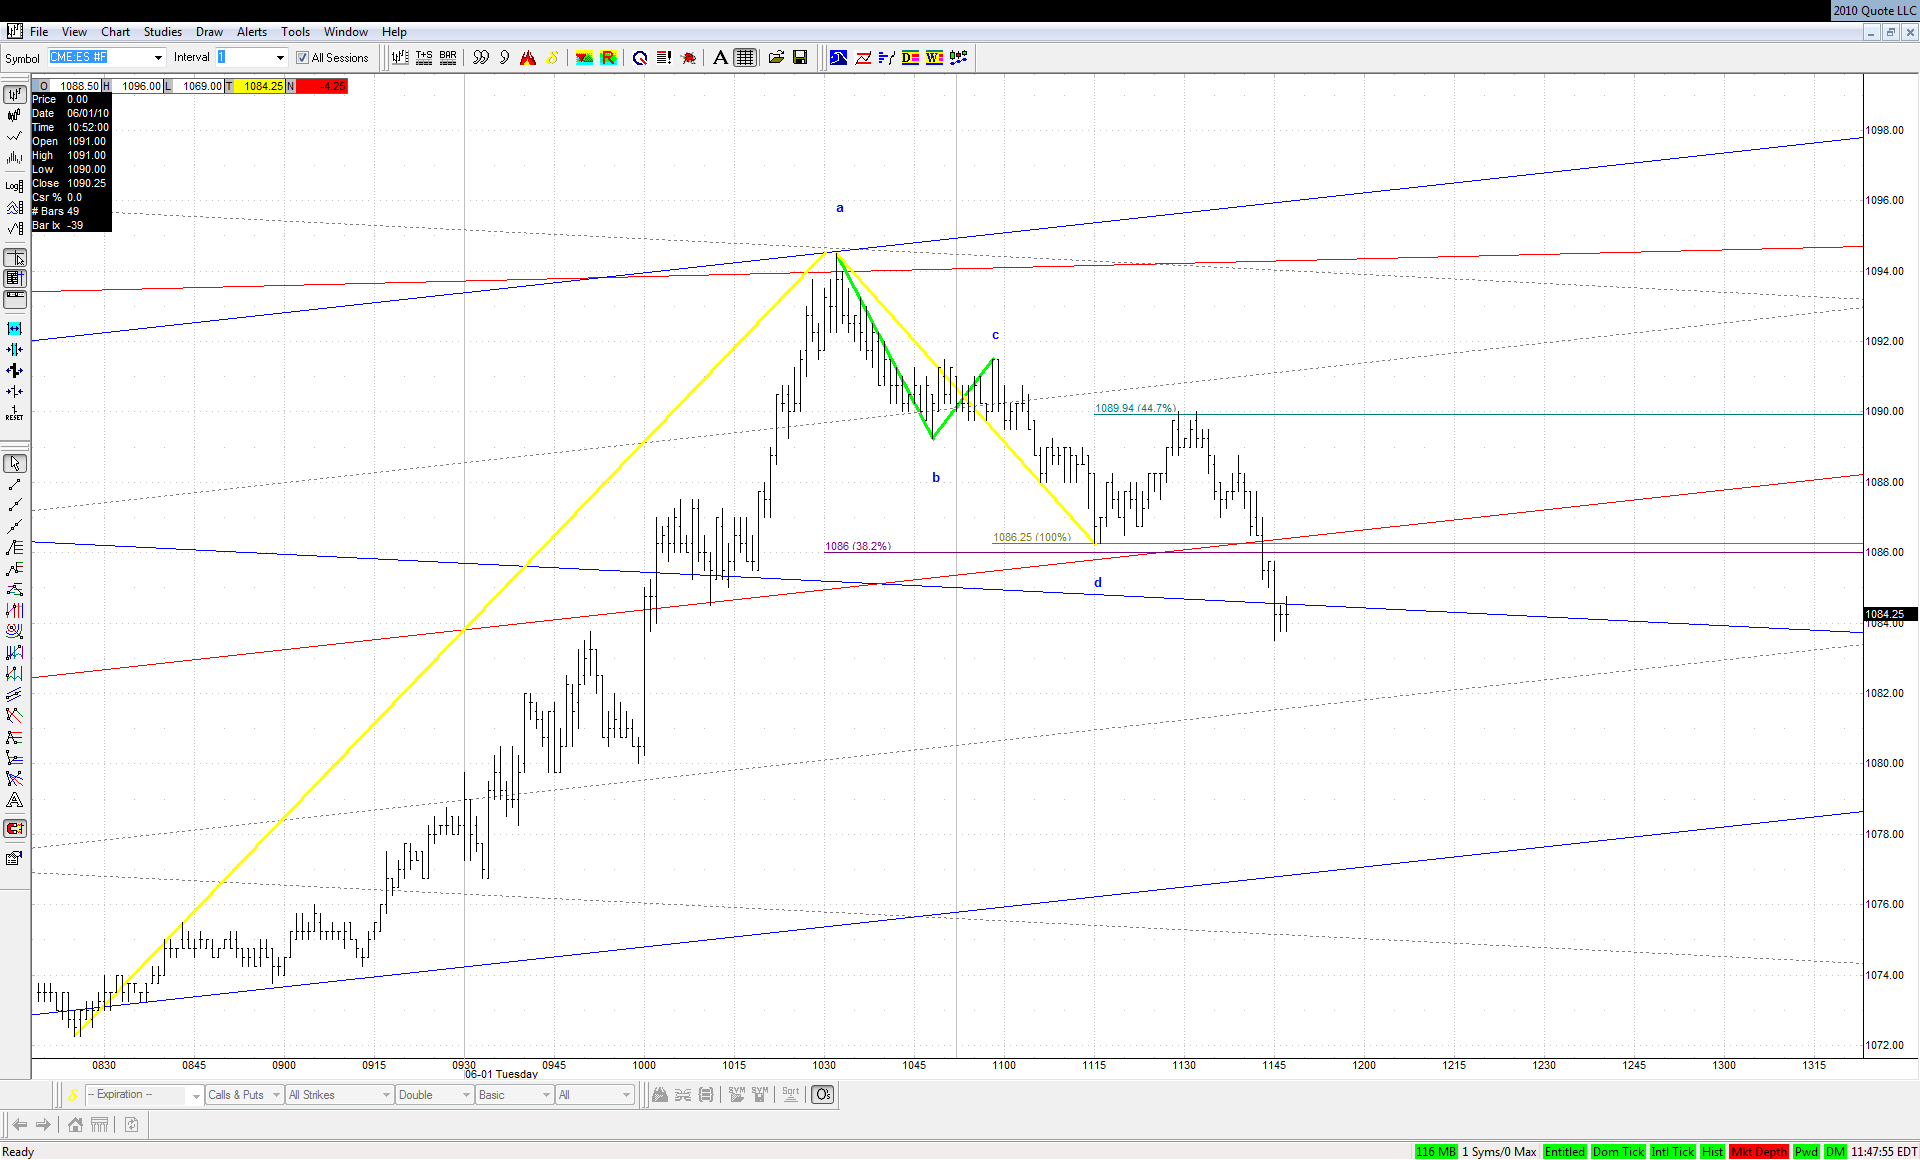
So, I was hoping that would be a flat/4PT hybrid ABCD there as this rose so strongly, and then a roll. I got is. Now it's in the area for a bullish ABCD or a 'W3' down, so I'm watching here for clues. Lots of things here, so it's do or die for the bulls. If this breaks down here then it is shaping up like a classic 1-2-3 off that sweet bearish ABCD jarek showed, and that would be quite nice. But, everyone's talking bullish as heck again with this run up, so maybe it follows the crowd and the MRRD's get the call, and up it goes. We'll see. It does what it does, and all I can do is respond.
JI
jimkane
Rep: 3,058
Posts: 33,089
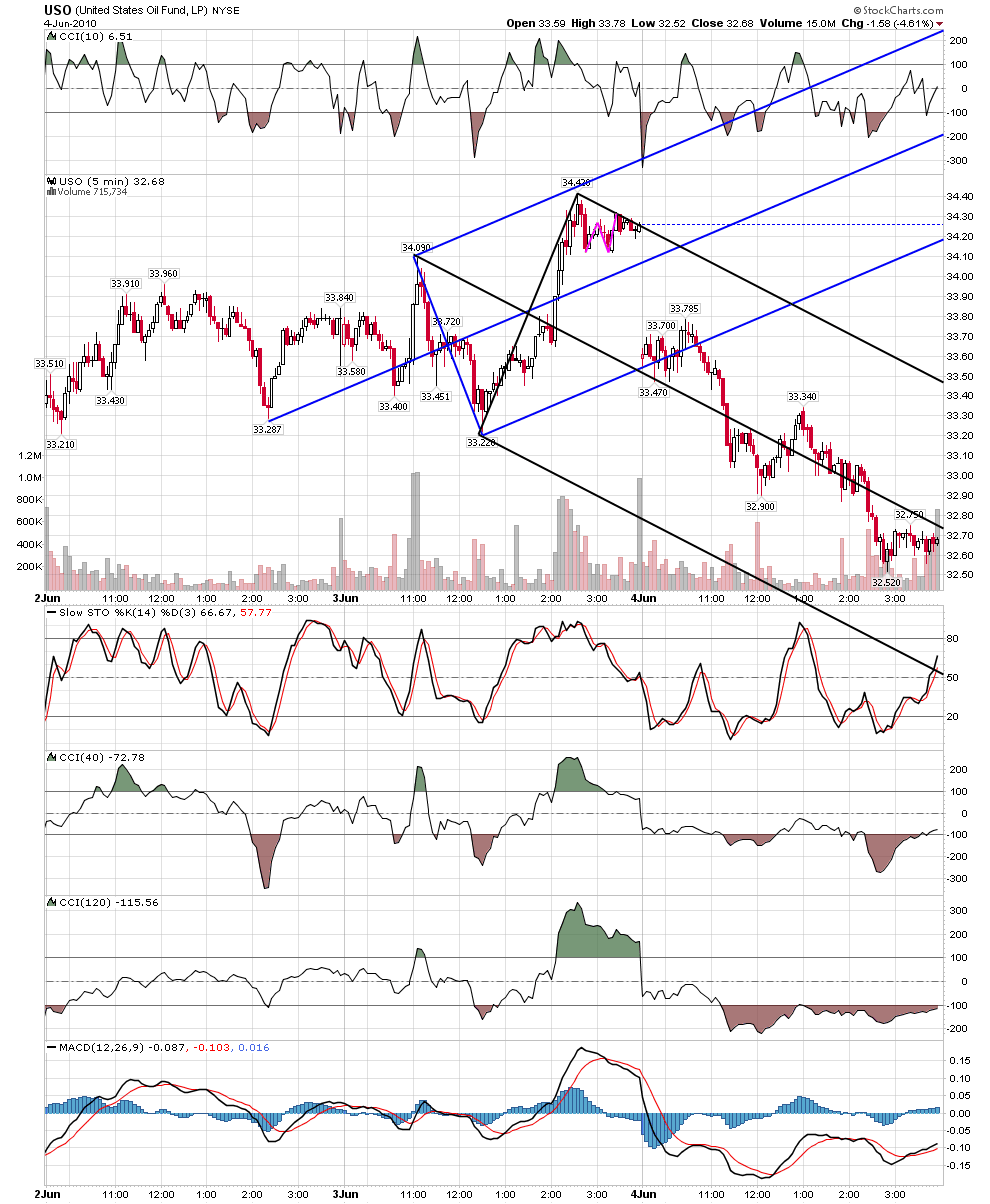
Talk about central bank intervention... Crude jumped about $4 a barrel, the Euro almost 250 pips, the ES over 25 points, all starting at the same time. But heck, it's great for trading. Just crazy, though.
JA
jarek
Rep: 94
Posts: 3,474
Originally posted by jimkane
Talk about central bank intervention...
But why does it happen in the exact spot you're looking for a bounce??
JI
jimkane
Rep: 3,058
Posts: 33,089
Originally posted by jarek
Originally posted by jimkane
Talk about central bank intervention...
But why does it happen in the exact spot you're looking for a bounce??
Great question. I don't know why that is, but I sure do see it a lot of the time...
RO
roofer
Rep: 3,689
Posts: 3,574
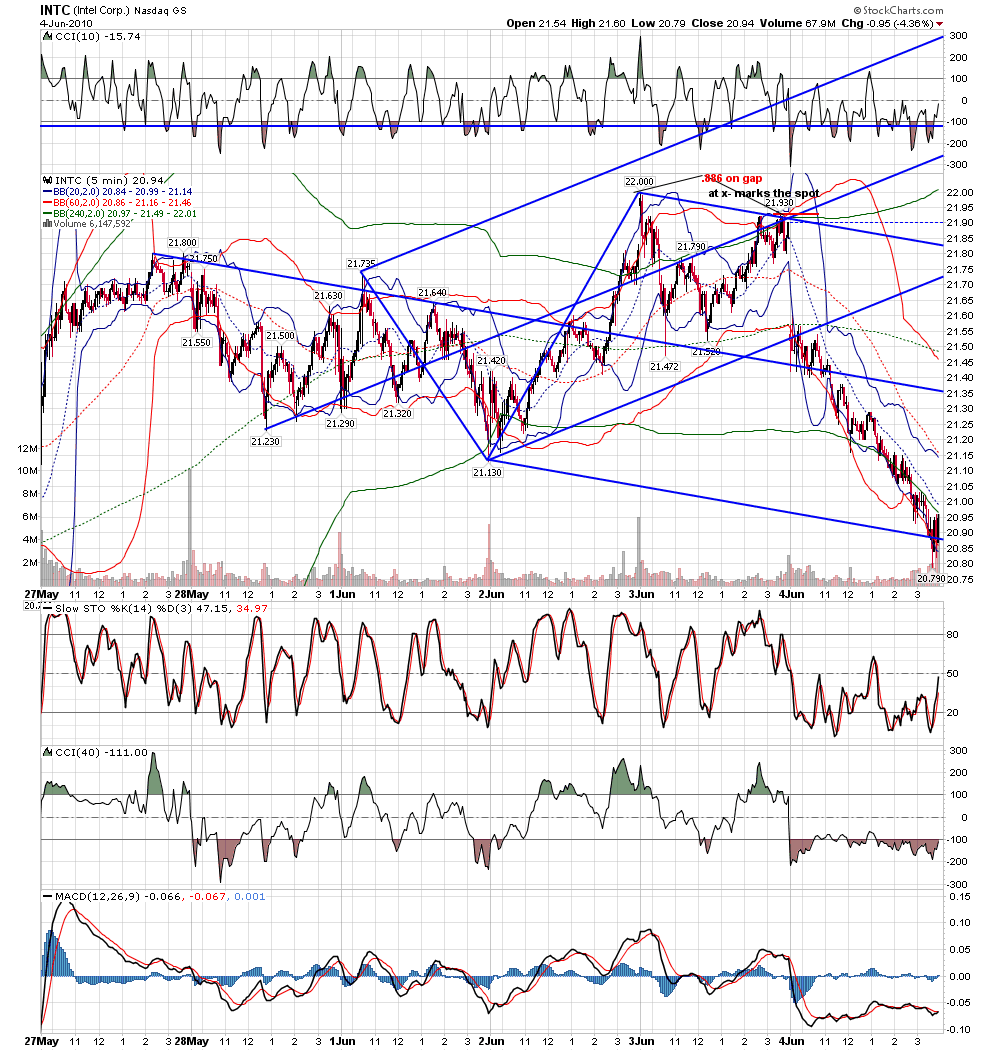
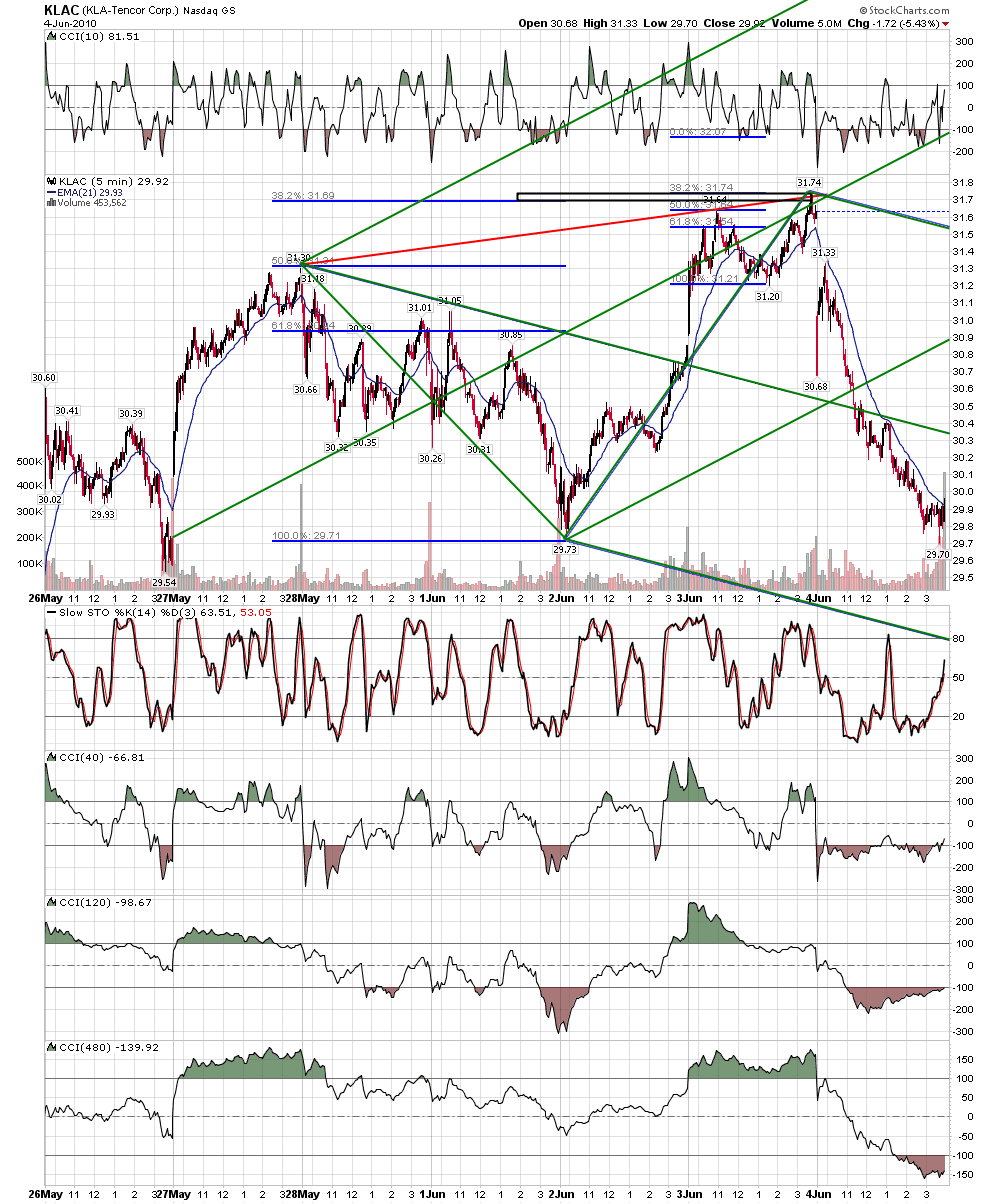
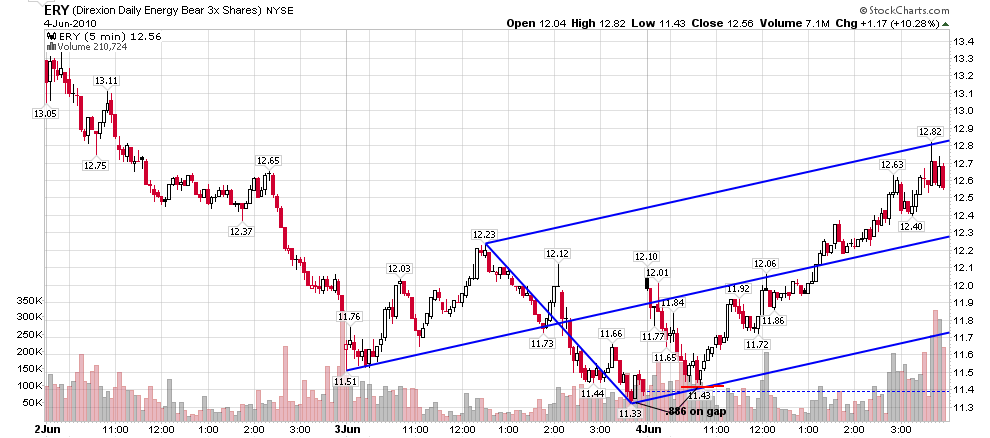
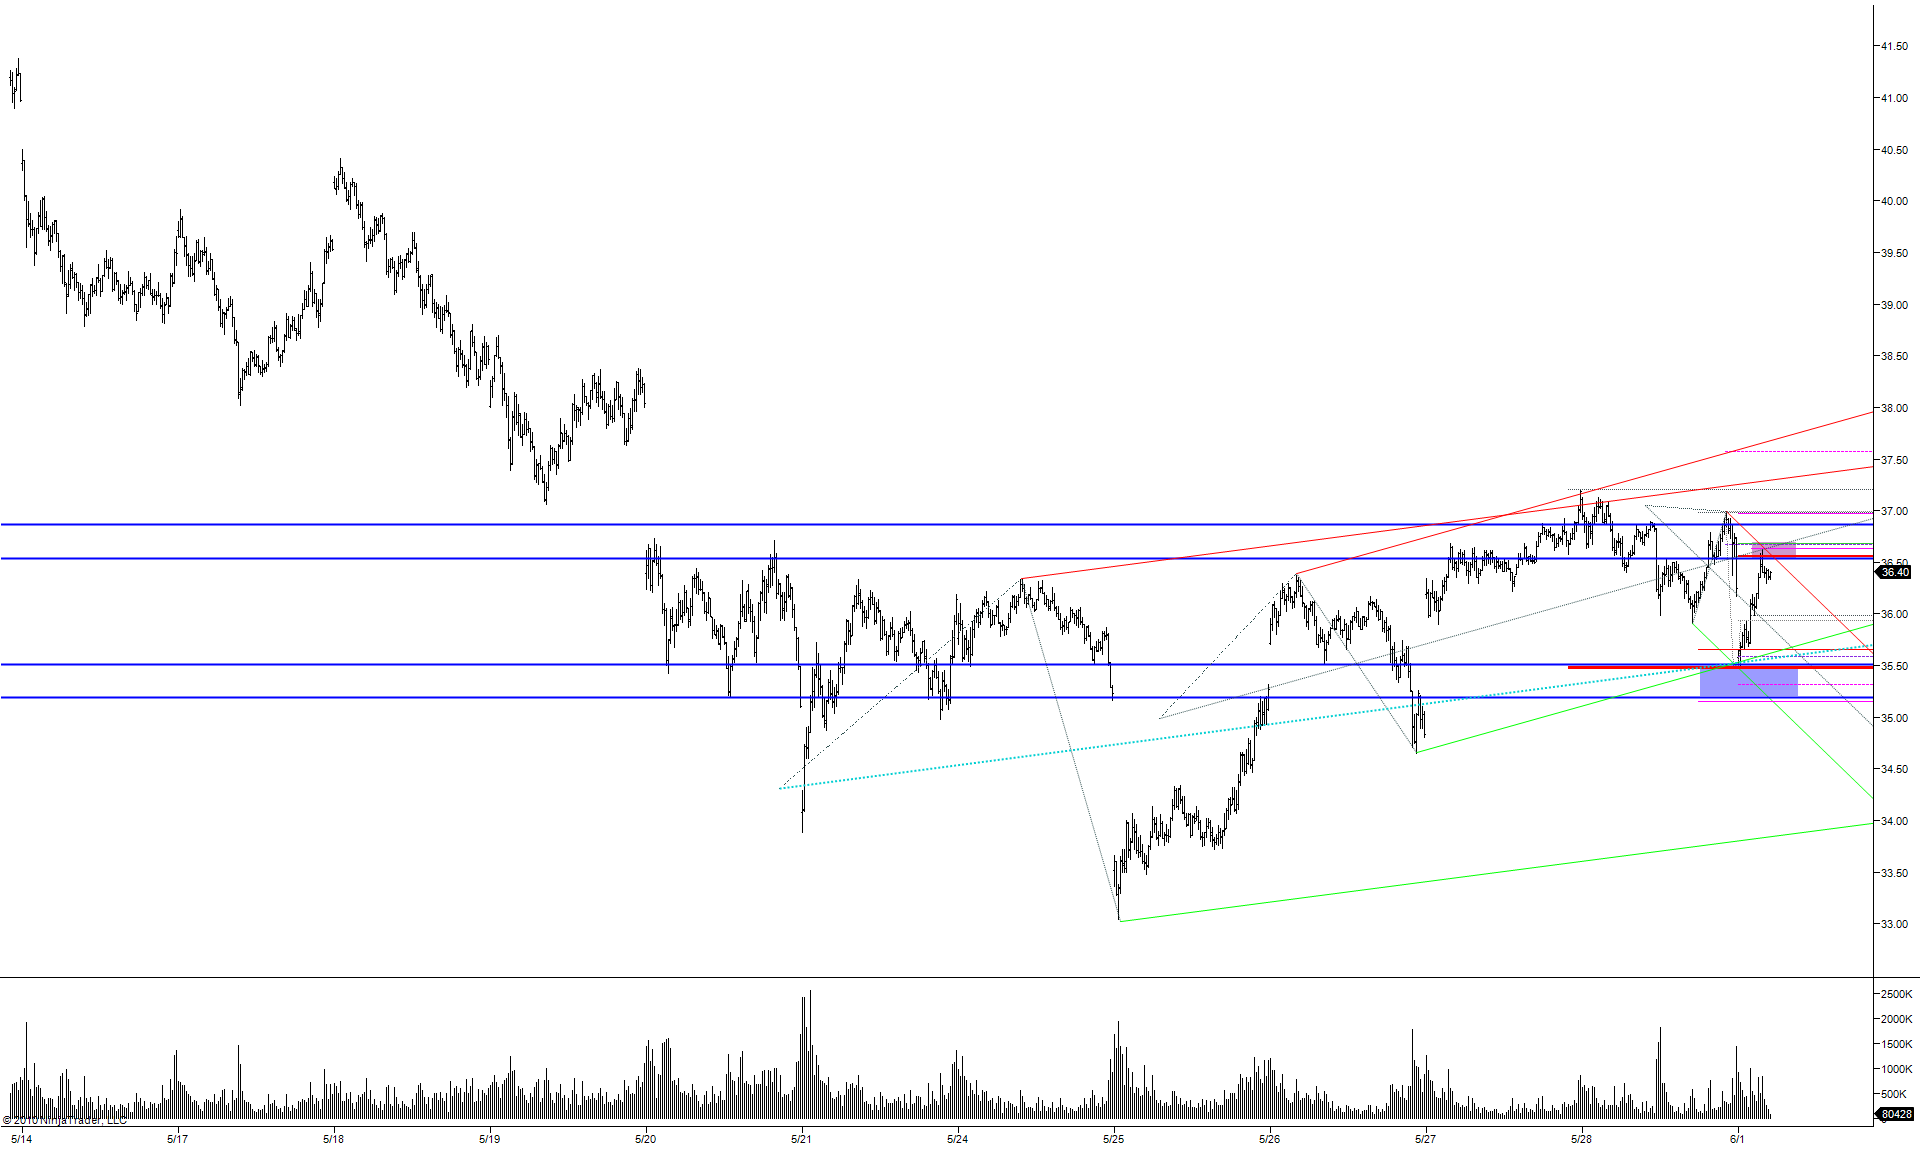
traders here know i trade a stack of charts in groups of ten to look beyond the indexes to see if the parts support a bias in the market.. especially before a big report i ask the cold hard question strictly based on the geometry...'' is the geometry of sell or buy in place on the previous days close.. so that no matter how ''good or bad'' the news, the computers already know how they will react?''then i ask after the initial reaction on the open'' does any additional geometry, usually an 886 on gap at line, support a continued push all day in one direction...?''here is a glimpse of my charts... note KLAC is an old favorite of jim's... the dbs was just waiting to blast.