Volume Nodes
I'm hoping to get some discussion started on these. Most know them as Points of Control. O/N this chart they are based on volume not time so sometimes the 4 P.M EST close creates the high volume node and sometimes you can see more than one key node. Anyway , it's a start..
The red line is the peak volume for each day and my software automatically extends them over if the aren't traded through the next day
I had to shrink this down in order to fit these on the chart.
The red line is the peak volume for each day and my software automatically extends them over if the aren't traded through the next day
I had to shrink this down in order to fit these on the chart.
Click image for original size
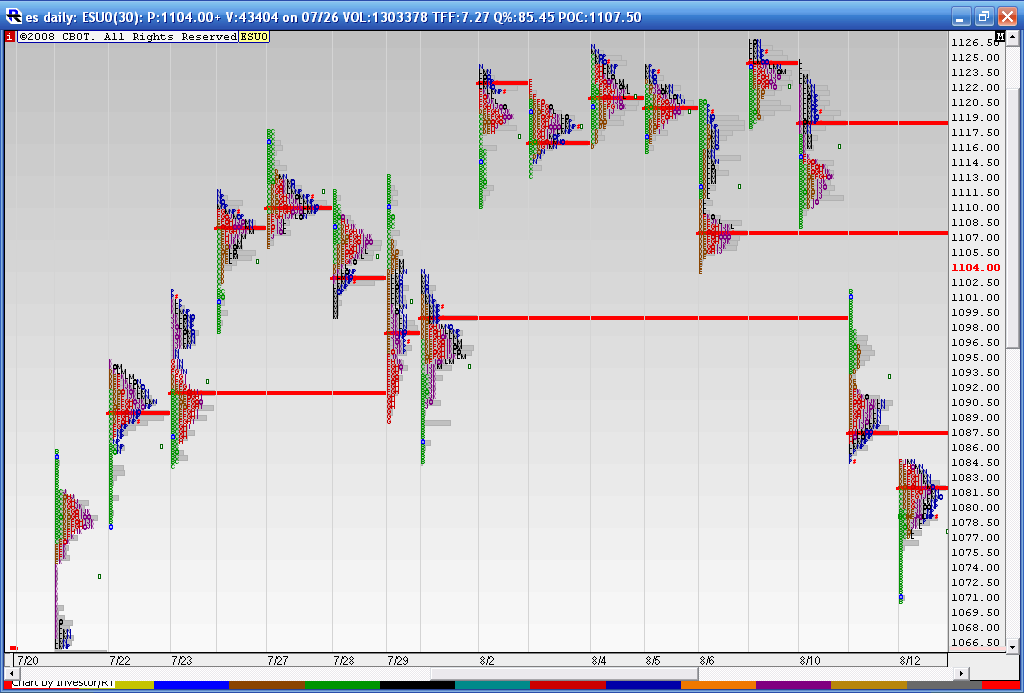
So whats your thinking on these? Support/Resistance zones or targets to use for trades?
Perhaps they could be used somewhat like pivots, above equals bullish bias, below equals bearish bias...just thinking out loud.
Thanks Bruce.
Perhaps they could be used somewhat like pivots, above equals bullish bias, below equals bearish bias...just thinking out loud.
Thanks Bruce.
all of the above Lorn...but we need to make it better...naked POc's are very popular areas to watch..if an area attracted that much volume for a specific day than we need to be aware of it. I was fascinated by the idea that BeyondMP shared with us about using naked 30 minute POC's.
But why 30 minutes ? why not 60 or 90 minutes or 1/3 of a trading day...why do most focus on the daily POC's in their work?
But why 30 minutes ? why not 60 or 90 minutes or 1/3 of a trading day...why do most focus on the daily POC's in their work?
Like the way you use the developing Vwap....perhaps combine the two areas.......
Originally posted by Lorn
So whats your thinking on these? Support/Resistance zones or targets to use for trades?
Perhaps they could be used somewhat like pivots, above equals bullish bias, below equals bearish bias...just thinking out loud.
Thanks Bruce.
A little history might be helpful.
When, Steidlmayer first designed Market Profile there were no electronic markets. He was looking for a quick and easy method to organize market data, on the fly, in the pits- a very fast paced and chaotic environment. He defined TPO's as: Time at Price=Volume. In other words, Time at Price was a proxy for Volume.
Today, in the electronic markets, we have actual Volume available. We don't need to use a proxy, we can use actual Volume.
Now, to the 30 minutes. When, Steidlmayer was trading in the pits, traders were supposed to turn in their handmade kept order sheets every 30 minutes for reconciliation by the clearing houses. Thus, 30 minutes was the "natural" unit of time for him to use for each period.
Is there anything magical about 30 minutes, absolutely not. It just became the "default" setting. The thoughts about other time frames, I think, needs to be examined, in the context, of what a Volume Node is and what it means as a "piece" of the trading puzzle.
Hey thanks for chiming in Bmp. It's amazing how most of the tools traders use were actually developed before all this instantaneous information world we presently live in.
Fascinating he was trying to determine where the volume was in the market. Fascinating and so simple really.
Cheers.
Fascinating he was trying to determine where the volume was in the market. Fascinating and so simple really.
Cheers.
The longer term puzzle fascinates me. It seems that we could look for volume clusters in the day time frame so it may not matter if we use 30, 60, 90 minutes etc . I'm not sure yet..
How do we know if we will attract back to the current days naked POC's or expand and keep going to previous completed days POC's...then there is the overnight...
A bit overwhelming to fiqure out what is really valid...just throwing some random thoughts out there..I need to get more focus..
BeyondMP, you have posted charts of Overnight POC's etc...how do we tilt the odds in our favor and use them as targets ? I currently look at the Cumulative POC from the O/N and minor nodes but I haven't determined if running a 30 minute O/N is a better choice..
Lots of rambling thoughts today...I need to get some foucs.
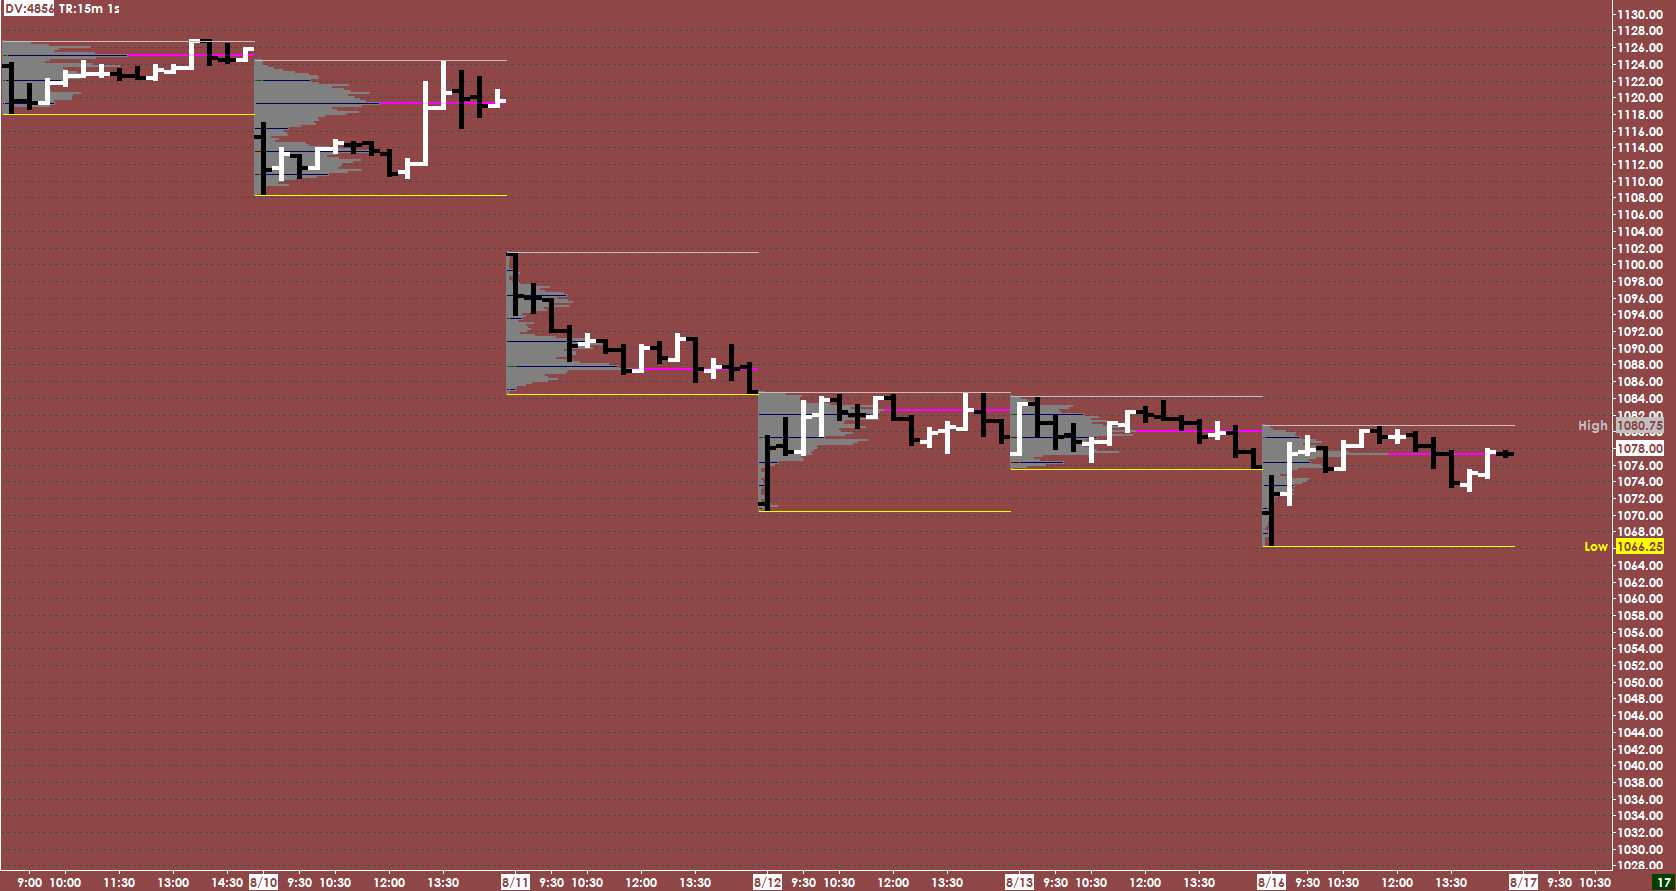
One of the ways is to keep an eye on a 30 min. chart. During the day the direction of a 30 min. bar in relation to the developing volume profile gives a very good "heads up".
Please look at the attached chart. One of interesting things is; this is really a "poor man's" Market Profile chart. Since MP charts are usually based on 30 min. periods, they really are just a 30min. bar chart "compressed." By breaking it out in this manner it is much easier, for me, to visualize the rotations and developing trends.
In the next few days I plan to discuss some thoughts about Hi Volume Nodes and their usefulness in trading. Until then, I hope this image and thoughts help.
Click image for original size
here is how we are looking now at days close . We came within 2 ticks of our 1065.75 number as per the peak volume node from 7-21 ( red line at the low) and rallied.....so are we on the way to fill in the 1090.50?
just pointing this chart out...how can we tilt the odds and try an fiqure out which HV node will trade first...Note how the last 3 days have seen the POC migrate lower..are we "due" to create a HV node at higher prices tomorrow?
just pointing this chart out...how can we tilt the odds and try an fiqure out which HV node will trade first...Note how the last 3 days have seen the POC migrate lower..are we "due" to create a HV node at higher prices tomorrow?
Click image for original size
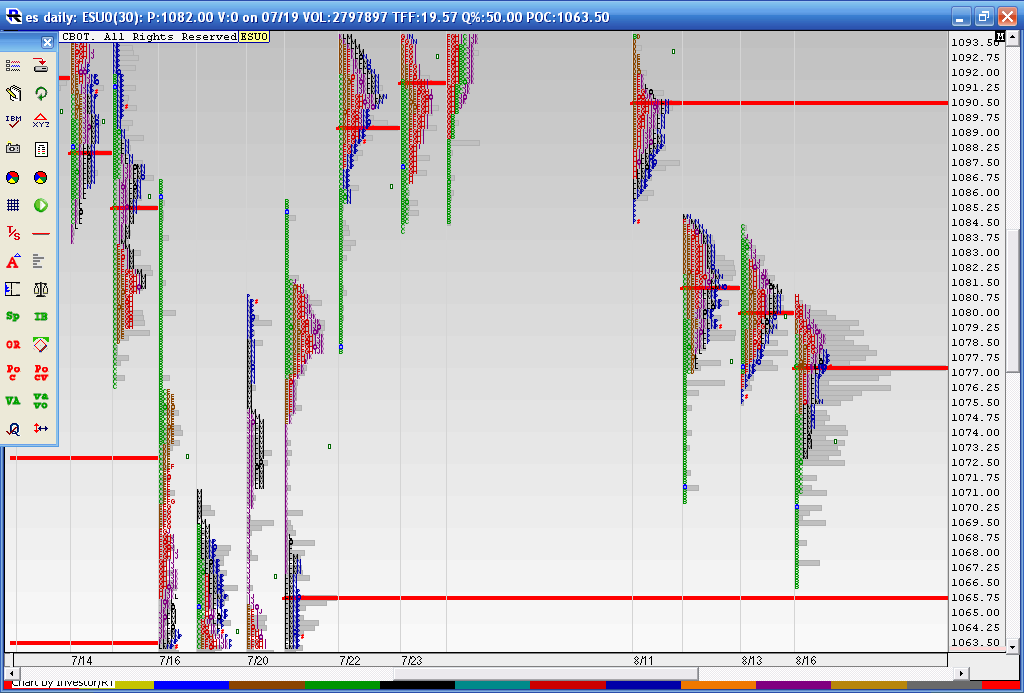
This seems to create the "P" profile which shows a bit of a struggle to extend range higher. Is the smart money staying short ? Value is being established at Lower prices..
Thanks for that Beyond. I look forward to yours and others contributions
Thanks for that Beyond. I look forward to yours and others contributions
Originally posted by beyondMP
One of the ways is to keep an eye on a 30 min. chart. During the day the direction of a 30 min. bar in relation to the developing volume profile gives a very good "heads up".
Please look at the attached chart. One of interesting things is; this is really a "poor man's" Market Profile chart. Since MP charts are usually based on 30 min. periods, they really are just a 30min. bar chart "compressed." By breaking it out in this manner it is much easier, for me, to visualize the rotations and developing trends.
In the next few days I plan to discuss some thoughts about Hi Volume Nodes and their usefulness in trading. Until then, I hope this image and thoughts help.
Click image for original size
Bruce,
By chance I came across your new topic today. I have previously brought to your attention Value Area (VA) Overlay charts. D.L. Jones of Cisco-Futures urges one to not only refer to the previous day's VA values but to include the previous three day VA overlay chart in one's preparation.
The chart I submit was originally created over the weekend for Monday's trading annd all my "important" information was created in red. Today with the RTH Gap up opening I updated levels of note in blue as an aid to today's trade.
I noticed you considered the MP chart a typical "p" formation after Monday's day session. I think you will perhaps consider that looking at the 5 day VA Overlay chart and filling that in with Monday's data the overall 6 day VA overlay was now more like a "b" formation.
With today's RTH gap up opening above the VAHs and POCs of the last two sessions the market was likely to trend up. With today's RTH first 5 minute low remaing unchallenged after the first 15 minutes it looked as though it would be up trending until we hit a stopping price.
My contribution to this topic would be to stay with classic 30 minute TPO charting for RTH and 24 hour trading and to make running e day VA Overlay charts part of every day's preparation as per the good advice of D.L. Jones of Cisco-Futures.
Sincerely,
DWD
Click image for original size
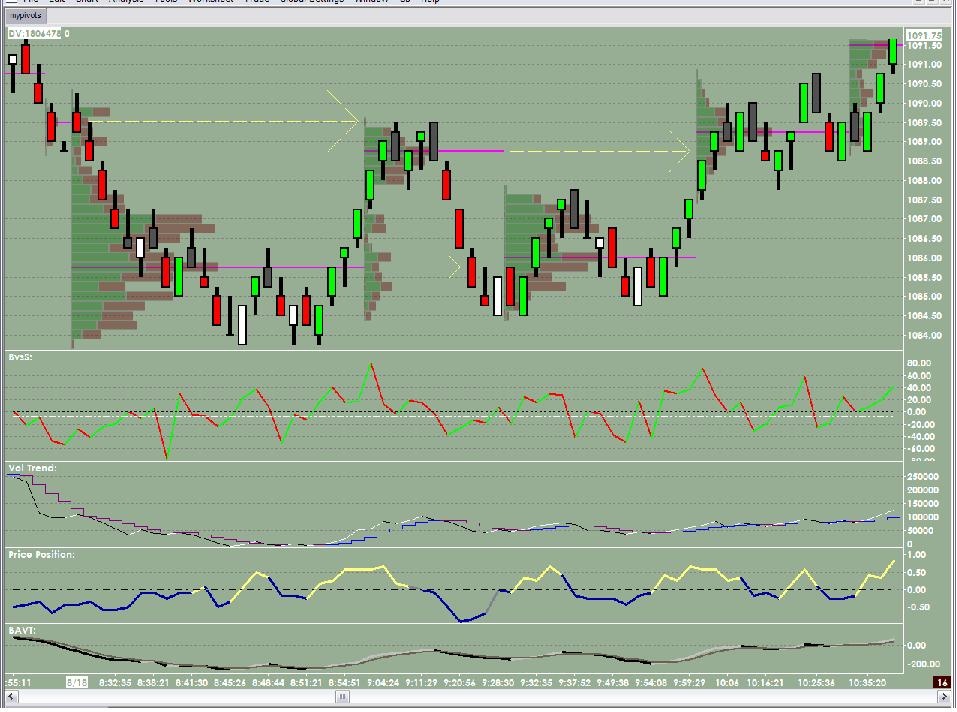
lets see if we can get some interest on this.......to start I'd like to know what specifically the lower panes are.....I can't read the chart.......then perhaps we can move to the application of those indicators/volume breakdowns
Originally posted by beyondMP
Here is a chart from the morning of 8/18 that illustrates the movement from node to node. You can also see, the info at bottom of the chart, which represents the breakdown of volume into several different parts, which can give a good "heads up" for entry and exits.
Click image for original size
Emini Day Trading /
Daily Notes /
Forecast /
Economic Events /
Search /
Terms and Conditions /
Disclaimer /
Books /
Online Books /
Site Map /
Contact /
Privacy Policy /
Links /
About /
Day Trading Forum /
Investment Calculators /
Pivot Point Calculator /
Market Profile Generator /
Fibonacci Calculator /
Mailing List /
Advertise Here /
Articles /
Financial Terms /
Brokers /
Software /
Holidays /
Stock Split Calendar /
Mortgage Calculator /
Donate
Copyright © 2004-2023, MyPivots. All rights reserved.
Copyright © 2004-2023, MyPivots. All rights reserved.