ES Short Term Trading 8-16-2010
Range Based S/R
R1 = 1093.125
S1 = 1068.375
R2 = 1097.25
S2 = 1064.25
Steenbarger Pivot = 1078.375
Middle week of August. Will it be more weak volume summer trading? A change of pace? Have to fire up the charts and watch the action unfold to find out!
R1 = 1093.125
S1 = 1068.375
R2 = 1097.25
S2 = 1064.25
Steenbarger Pivot = 1078.375
Middle week of August. Will it be more weak volume summer trading? A change of pace? Have to fire up the charts and watch the action unfold to find out!
single prints should fill in below unless new HIGHER volume comes back in to fool me..
75.50 is my target on runners...the 79.25 price was the precise peak volume thrust from Friday's trade....the tic price that had the biggest volume...this is not the cumulative peak volume price
Are you referring to 1068.25 and below?
Originally posted by BruceM
single prints should fill in below unless new HIGHER volume comes back in to fool me..
no lorn...single prints off 30 minute.....the most popular concept...should be hyper linked.....let me know if you don't get an answer through the link
I don't follow triples that FORM in O/N.....rgearding your other question...gotta go swim!!
I don't follow triples that FORM in O/N.....rgearding your other question...gotta go swim!!
Originally posted by Lorn
Are you referring to 1068.25 and below?
Originally posted by BruceM
single prints should fill in below unless new HIGHER volume comes back in to fool me..
I am finished for the day.
Good trading to all.
Good trading to all.
Lorn, In general the O/N areas need to be confirmed by something from the day session...some day session, not specifically the preceding session ...the only real exception would be high volume created by a pre - open reports...
Do u have Market profile software...? Is that Ninja that you show? be back later
Do u have Market profile software...? Is that Ninja that you show? be back later
Thanks. I understand what you are saying. My only thought is O/N has big moves these days and a lot of times the move is over before RTH starts but I suppose that doesn't really fit into the fader mindset.
Cheers!
Yes markedelta software does MP.
Cheers!
Yes markedelta software does MP.
Originally posted by BruceM
Lorn, In general the O/N areas need to be confirmed by something from the day session...some day session, not specifically the preceding session ...the only real exception would be high volume created by a pre - open reports...
Do u have Market profile software...? Is that Ninja that you show? be back later
There are now two sets of quads on the screen.....
78.50
75.25
Whats the strategy here Bruce? Trading towards them?
78.50
75.25
Whats the strategy here Bruce? Trading towards them?
that's my general plan up here in light volume and key numbers
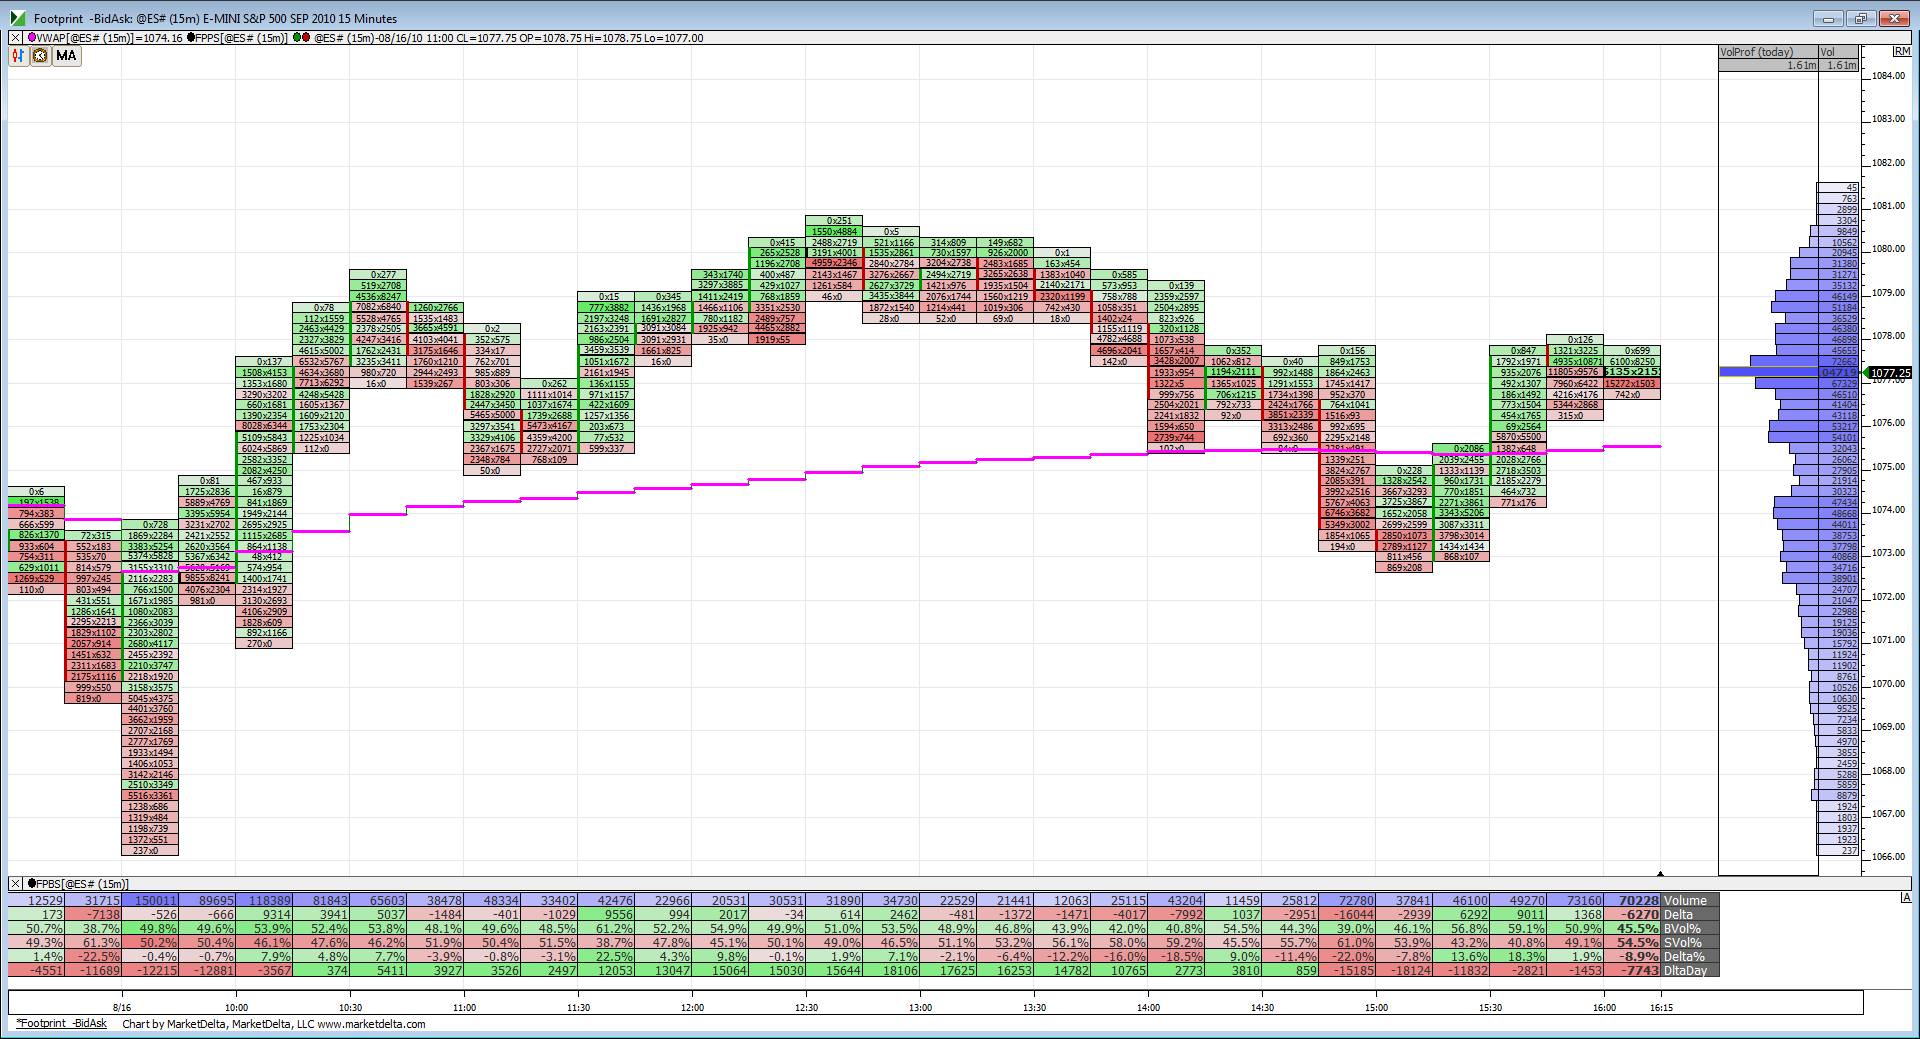
A look at RTH on the footprint chart. One attempt close to 3:00 to move below VWAP but was able to regain its footing.
Click image for original size
Emini Day Trading /
Daily Notes /
Forecast /
Economic Events /
Search /
Terms and Conditions /
Disclaimer /
Books /
Online Books /
Site Map /
Contact /
Privacy Policy /
Links /
About /
Day Trading Forum /
Investment Calculators /
Pivot Point Calculator /
Market Profile Generator /
Fibonacci Calculator /
Mailing List /
Advertise Here /
Articles /
Financial Terms /
Brokers /
Software /
Holidays /
Stock Split Calendar /
Mortgage Calculator /
Donate
Copyright © 2004-2023, MyPivots. All rights reserved.
Copyright © 2004-2023, MyPivots. All rights reserved.