ES Short Term Trading 8-17-2010
Range Based S/R
R1 = 1085.25
S1 = 1062.50
R2 = 1089.125
S2 = 1058.625
Steenbarger Pivot = 1075.50
Prices have already traded to and a bit beyond R1 in the O/N. Will be telling if VWAP can support prices when RTH opens.
R1 = 1085.25
S1 = 1062.50
R2 = 1089.125
S2 = 1058.625
Steenbarger Pivot = 1075.50
Prices have already traded to and a bit beyond R1 in the O/N. Will be telling if VWAP can support prices when RTH opens.
In addition to previous levels noted.
1104 - 62% and 1113 76% retrace levels up above 1097. 1115 the major S/R level
retrace levels down from1098.5?? 1093, 1091, 1089 areas.
1104 - 62% and 1113 76% retrace levels up above 1097. 1115 the major S/R level
retrace levels down from1098.5?? 1093, 1091, 1089 areas.
Absolutely 1115 is big resistance, let's see how the market treats 1105 first.
Let me get this out here for reference as my runners hopefully do some magic for me. It is my MP chart from 8-11. Pay particular attention to the big volume nodes at 87.50 , 90.50 and 95.50...will discuss when I have more time and not babysitting this campaign
Click image for original size
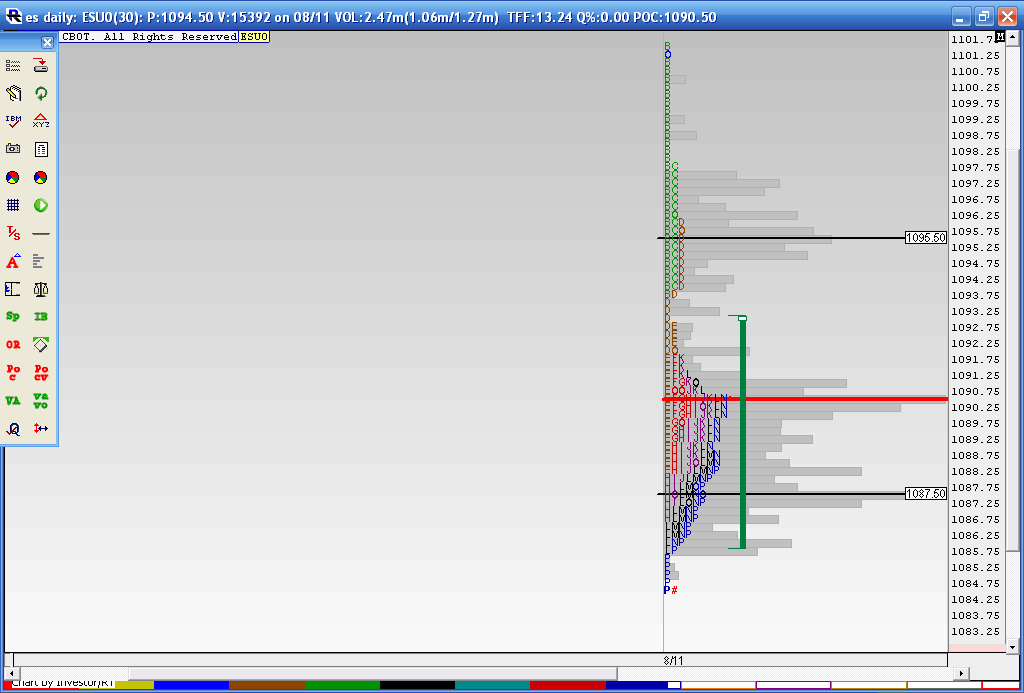
somebody beside me is liking that 95.50...big volume....I think they will play with that again..
Lorn, The best way to use triples or anything is to put them in context...but your observation still stands...there will be those who expect them to hold as support ( In this example) and they will try and drive it the 8- 10 points....that would have given you an upside target in the 92.25 - 94.25 range...not too shabby but as a Fader I'm always looking at mean reversion with my eye on watching for the REAL breakout...I took my first loss at 93.50...on that fade..I also sold 95 as that was another peak volume node I was watching from 8-11...see that chart I posted...and my runner contracts where trying for those triples that never got the target either at 92.75.....we know one really good thing...and that is when we trend they won't come back for Trips or fibs or anything....so all we can really learn is to look for the signs of trend ///as u know that has been my focus
Today we had that low range 60 minute range ( Paul you worded that better) so trying for trips or any fade as I mentioned was going to be harder..so to your question...I really don't handle it well YET and until I can get freakin great at breakout trading ( which probably won't happen )then the best I can do is be more selective and wait for the resistance numbers to hit and not average in
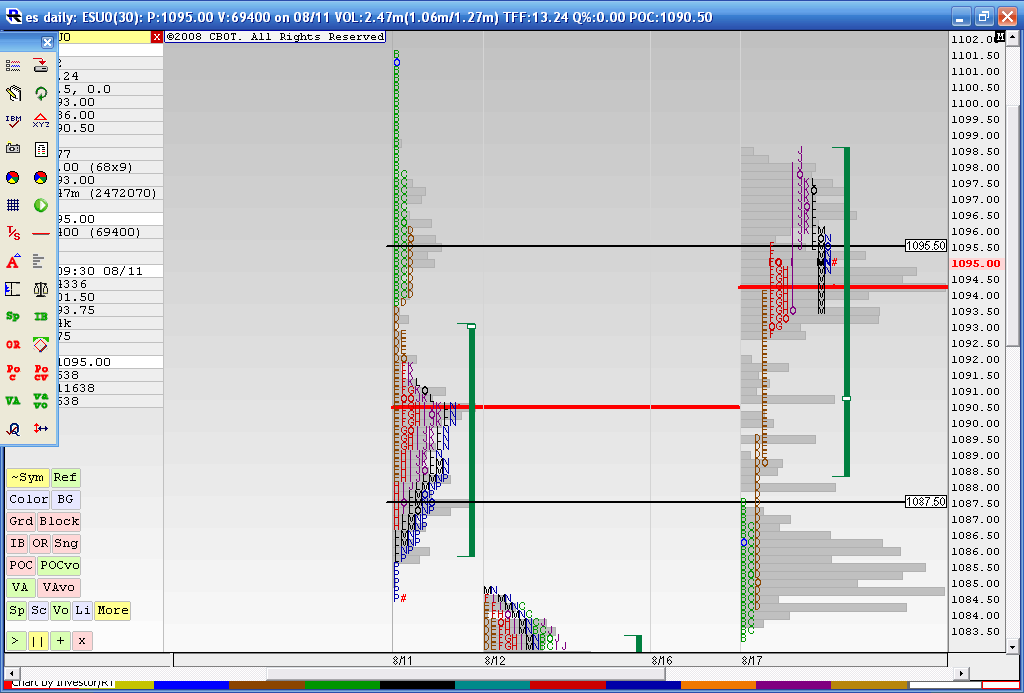
so here is how we are looking at 3:31....look at the volume node at around 90.75 form TODAYS trade....we can see that volume came in at the same area as it did on 8-11..so I was much quicker to exit on that fade earlier....although not a great exit ( for a loss) at least I knew not to average in...hope this helps somewhat..
Today we had that low range 60 minute range ( Paul you worded that better) so trying for trips or any fade as I mentioned was going to be harder..so to your question...I really don't handle it well YET and until I can get freakin great at breakout trading ( which probably won't happen )then the best I can do is be more selective and wait for the resistance numbers to hit and not average in
so here is how we are looking at 3:31....look at the volume node at around 90.75 form TODAYS trade....we can see that volume came in at the same area as it did on 8-11..so I was much quicker to exit on that fade earlier....although not a great exit ( for a loss) at least I knew not to average in...hope this helps somewhat..
Originally posted by Lorn
Bruce,
You mentioned one time when trips are left on the screen usually get a 8-9 pt move. How do you handle that situation? Trips at 1084.25.
Click image for original size
Thanks Paul...small range is a better way to say it...that is why I was more selective..that coiling up process.....too much pent up energy/orders..
91 years old,,,that's awesome I'm sorry to hear she is not doing well at the moment...I hope she gets better
The longer term Players will look at Mon- Tuesdays range the way us daytraders look at the first hour....They will use 1.5 times the range and 2 times the range etc...and also watch the midpoint..etc..
Originally posted by PAUL9
Originally posted by BruceM
gotta be very selective on any fades up into the 90 because we had a low range breakout of the first hour with a gap highr open
I know this all seems ex post facto, but I was in the midst of writing it when I had a phone call from one of my sisters concerning my 91 year old mother who is not in the best of shape. That phone call took priority.
Bruce,
when you say "low range breakout" are you referring to the 9:30-10:30 hour being such a "small" range? (I think small range would be a better descriptor than "Low range" because "Low" connotes price) I have read your notes on the "low" range bars, but I was wondering if you could comment a little on the quotation in this post.
Other matters
I have mentioned before that I have noticed that when Price hits the 618 extension of the Monday fibs that odds are very high for a move to the full, 100% extension of Monday's Range (meaning Monday's RTH range added to Monday's High.)
FIbs based on Monday's range were
My Label, UP 0.618 (would be 1.618 on a charting tool because range itself represents a "1" in front of the decimal, so for charting tool equivalents add a "1" for labels below)
Monday Fibs
UP 1.618 1104.25
UP 1.000 1095.25 (is highly possible this week due to price printing above 618 extension)
UP 0.618 1089.75 (Hit today makes full extension likely)
Monday High 1080.75
Monday Low 1066.25
1080.75 - 1066.25 = 14.50
14.50 added to Monday's High = 1095.25
1095.25 is the full extension of Monday's RTH range.
****
Bruce, you have mentioned something about viewing Monday and Tuesday as one range, but could you explain how you view that range? How you use that M-T range.
The reason I bring it up is because I have poured over years of charts to realize and have confidence in the observation I related about the Monday Fibs, and maybe Tuesday PA (where price moves relative to the Monday Fibs) can be predictive of whatever it is that you have observed when it comes to viewing Monday and Tuesday as a single range. (like if Tuesday prices couldn't get past 618 extension then reversal of price direction more likely, etc.),
OK, that's it from long-winded Paul
this is after the fact but I was holding one damn contract for that 92.75 triple run...this was second campaign off the 97.75 sells....but More important was watching that 95.50 volume surge..
Understanding the volume ( which isn't easy) can help improve any method....we can have fibs, pivots, MP, Tea leaves, astro, gann, a coin flip or anything but the VOLUME surges cannot hide from us..
The two biggest spikes are at 92.75 and 95.25 from today's trading...these are the precise points where Big volume came in outside of the first minute of trade....
87 - 89.50 is secondary to those two now
It's the constant testing and retesting of the volume surges that creates the VPOC's and value ares etc.....we need to know where the big players or common players pushed out the market
Ok, I get it..your posting this just to mess with me...LOL!
Is this any better than saying the first real resistance is todays high at 1098.50 ? As usual we are looking for tradeable, repeatable ideas....how about firing up some charts Big Mike....?
Seems like i"m having some challenges with the name "Mike" lately..
can't waste my hand power on this today!!
Is this any better than saying the first real resistance is todays high at 1098.50 ? As usual we are looking for tradeable, repeatable ideas....how about firing up some charts Big Mike....?
Seems like i"m having some challenges with the name "Mike" lately..
can't waste my hand power on this today!!
Originally posted by Big Mike
Done trading for today.
FWIW, looks to me like 1105 is the first "real" resistance that I see. Based on 8/11 and 8/6.
Good luck to all
Nah, no tweaking Bruce, I do learn from your posts. I just do not know how to apply them in real time. I'm an old slow fart!
By "real" resistance, I meant that level is the first untested level of equilibrium which when it broke down, led to a big move. If 1105 doesn't become resistance (it was support for 3 hours on 8/11), then 1115 is my next area of caution if I'm holding long.
Being the aforementioned old fart, I am so technophobic as to not be able to post charts. Hopefully, the narrative can get people to see the price action by itself.
Good luck to all! Love the site.
Originally posted by BruceM
Ok, I get it..your posting this just to mess with me...LOL!
Is this any better than saying the first real resistance is todays high at 1098.50 ? As usual we are looking for tradeable, repeatable ideas....how about firing up some charts Big Mike....?
Seems like i"m having some challenges with the name "Mike" lately..
can't waste my hand power on this today!!Originally posted by Big Mike
Done trading for today.
FWIW, looks to me like 1105 is the first "real" resistance that I see. Based on 8/11 and 8/6.
Good luck to all
thanks Mike for coming through with the goods...I appreciate it
Originally posted by Big Mike
This took some doing-LOL. This is all I have on my charts. K.I.S.S.
Base- rally-rise out of 1092
First test of support at 1105 broke
Next fresh retest of support was 1092 (target) broke
Click image for original size

Emini Day Trading /
Daily Notes /
Forecast /
Economic Events /
Search /
Terms and Conditions /
Disclaimer /
Books /
Online Books /
Site Map /
Contact /
Privacy Policy /
Links /
About /
Day Trading Forum /
Investment Calculators /
Pivot Point Calculator /
Market Profile Generator /
Fibonacci Calculator /
Mailing List /
Advertise Here /
Articles /
Financial Terms /
Brokers /
Software /
Holidays /
Stock Split Calendar /
Mortgage Calculator /
Donate
Copyright © 2004-2023, MyPivots. All rights reserved.
Copyright © 2004-2023, MyPivots. All rights reserved.