ES Short Term Trading 9-10-2010
Steenbarger Volatility Based S/R
R3 = 1108.75
R2 = 1106.75
R1 = 1104.75
Pivot = 1098.50
S1 = 1092.25
S2 = 1090.25
S3 = 1088.25
If you are interested in the formula to determine these here is the link to Dr. Brett's topic.
http://traderfeed.blogspot.com/2010/04/bonus-post-2-different-method-for.html
R3 = 1108.75
R2 = 1106.75
R1 = 1104.75
Pivot = 1098.50
S1 = 1092.25
S2 = 1090.25
S3 = 1088.25
If you are interested in the formula to determine these here is the link to Dr. Brett's topic.
http://traderfeed.blogspot.com/2010/04/bonus-post-2-different-method-for.html
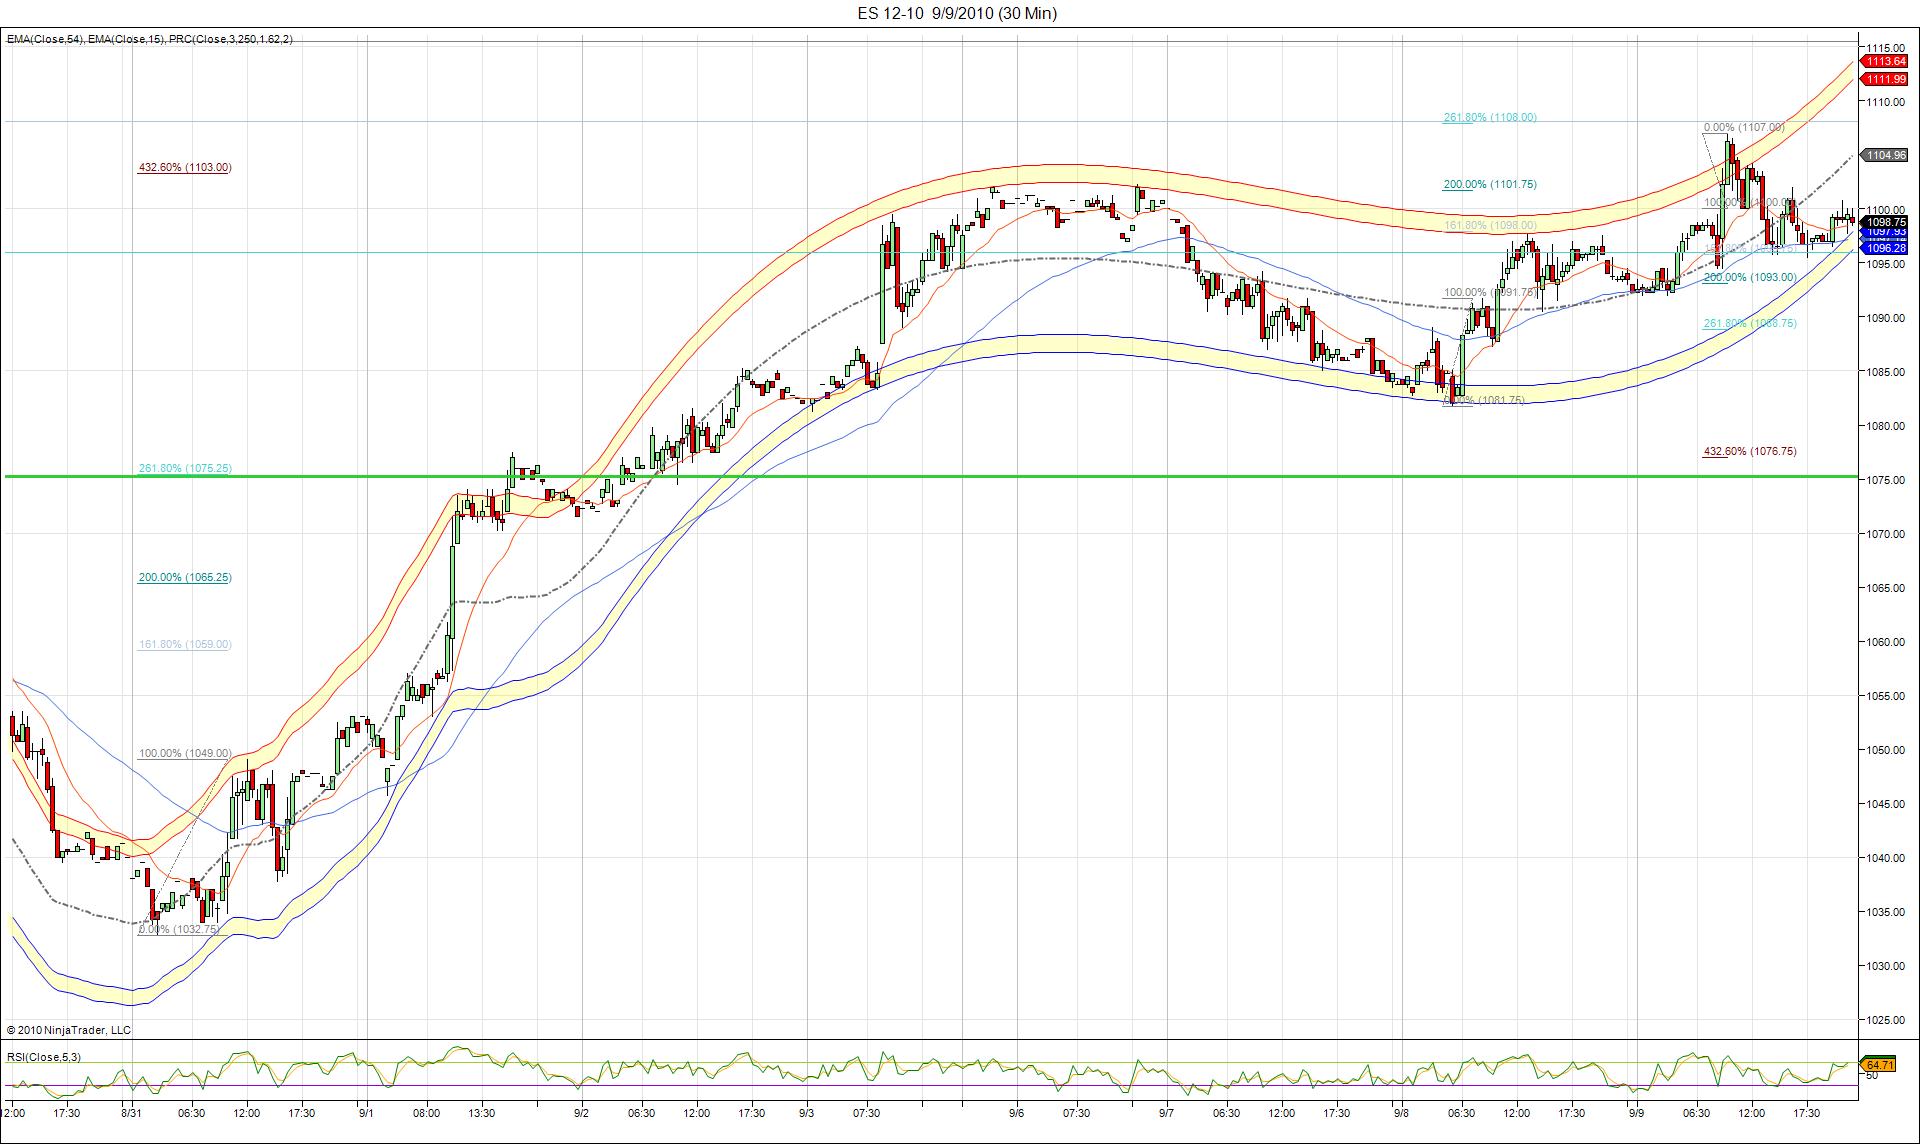
30-min PRC chart. Several fib projections for you to look at. Today's (Thursday) reversal came on the heels of bulls lapping up good news. That 4.326 projection off the 8/31 low was finally hit. We might have some wind in the southern sails for a bit. We hit the 1.618 projection off the high of 1107.00. If prices are gonna hit new highs tomorrow that level (1095.75, RTH low!) should hold. As always volume will show us the way.
Click image for original size
1101.25 and 1106.25 the 50% levels for the decline from yesterdays highs in 12-10 and 9-10 contracts.
1109.25 hit
Pauls 100% level from Tues range and reversal point Thursday.
BKX just under 47 and GS just under 150 here
watching semis for reversal up as bad news invited shorts to NSM and INTC here after both lowered guidance.
I'd keep an eye on the 1103/4 level if they decline below that 50% level in my arlier post, from Pauls note yesterday.
All numbers reflect Sept contract in this note.
Originally posted by DavidS
1109.25 hit
Pauls 100% level from Tues range and reversal point Thursday.
BKX just under 47 and GS just under 150 here
watching semis for reversal up as bad news invited shorts to NSM and INTC here after both lowered guidance.
I'd keep an eye on the 1103/4 level if they decline below that 50% level in my arlier post, from Pauls note yesterday.
Back to 50% levels.
Semi Holder(SMH) at low here under 25
Semi Holder(SMH) at low here under 25
A look at the footprint action so far. Seem to be struggling to stay above VWAP here. The 12:00 close will be telling. Notice delta at the bottom never really extended its positive bent as prices rallied to 1105. The NQ's have so far tested both there O/N highs and lows where as the ES has only tested its highs. Maybe some catch up is in the cards? Or else this is gonna be chop around VWAP for the rest of the day.
Click image for original size
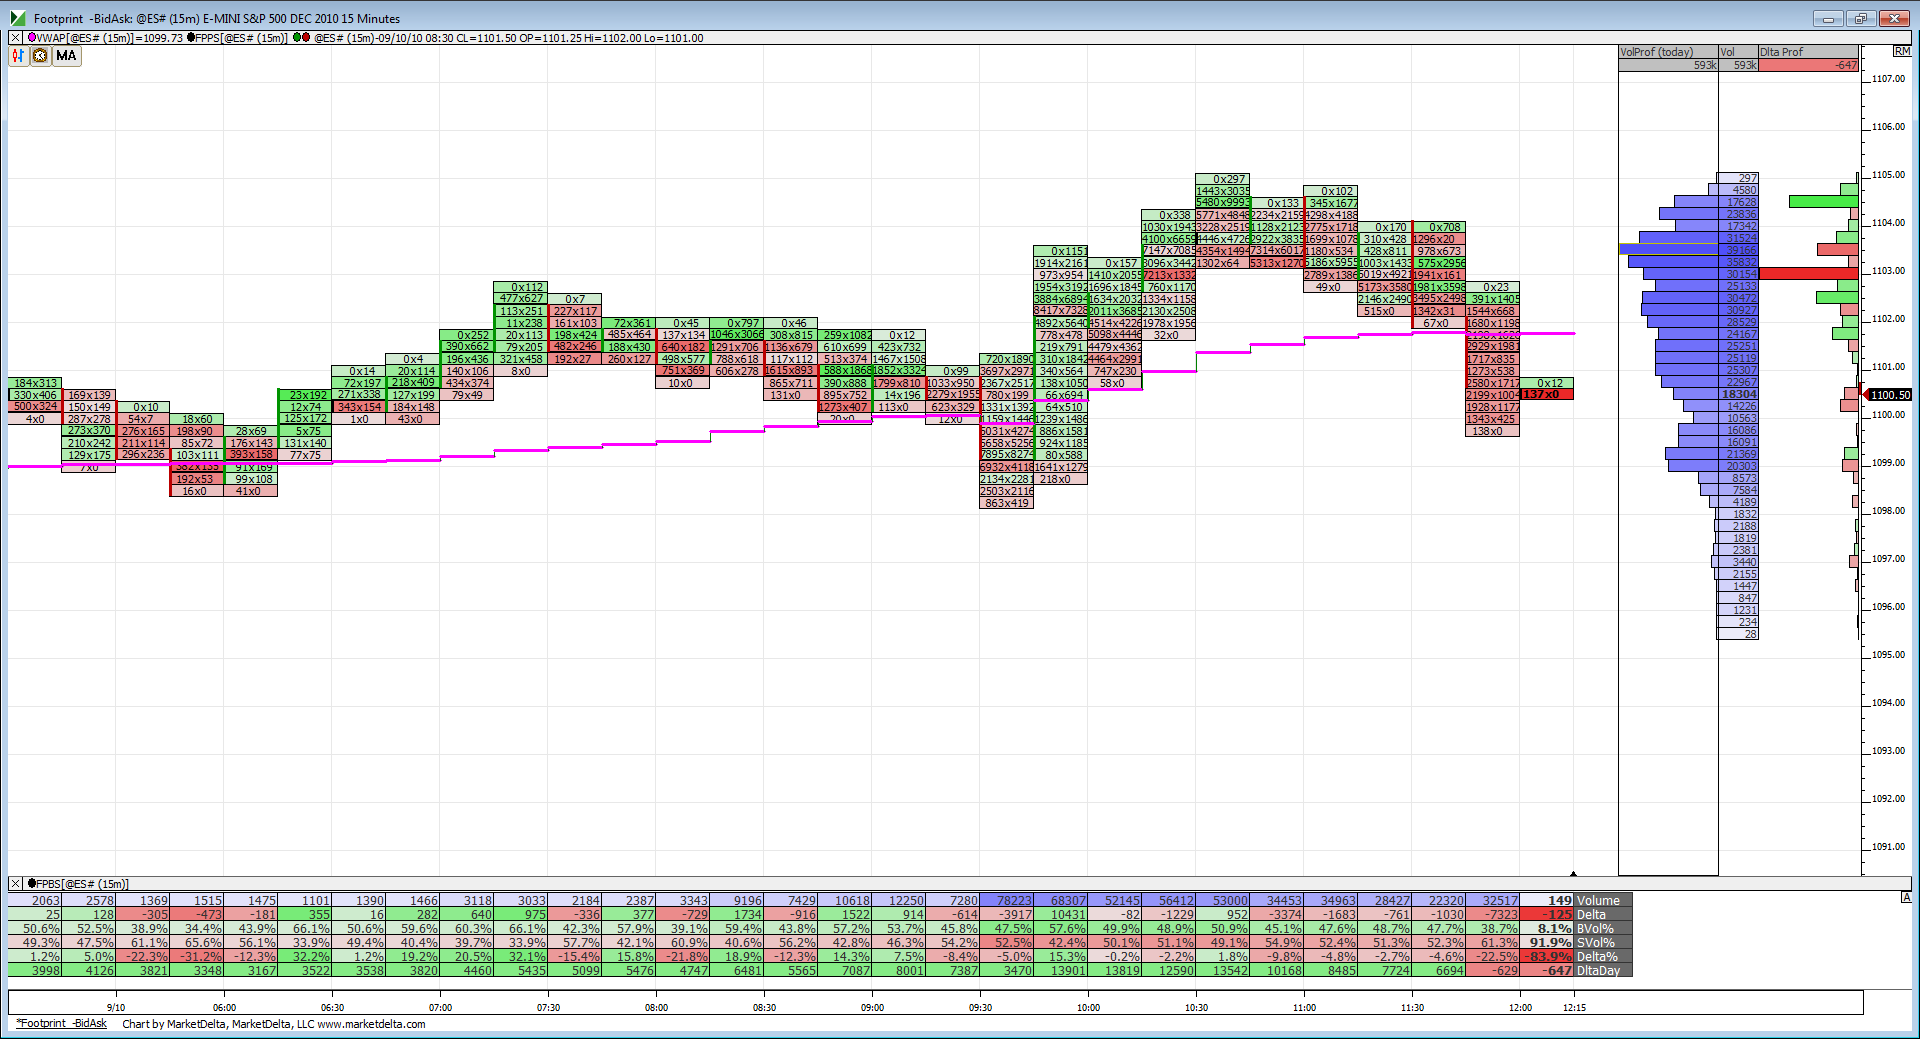
Looks like the VWAP chop. Unless new volume comes into the market we are going nowhere fast.
Click image for original size

SMH back above 25 from 24.72 low.
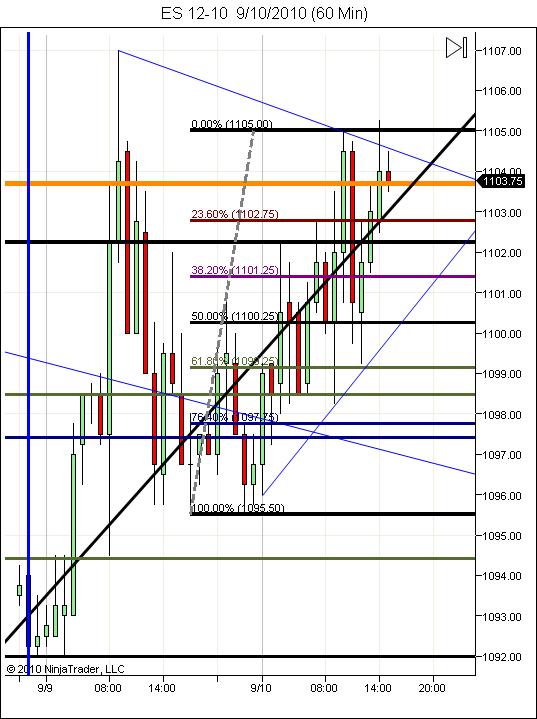
Anything that doesn't break yesterdays highs is bearish.ie new top between 1105 and 1107 12-10 contract. That 1105.25 qualifies as a reversal signal til it breaks.
Notice how they can't close a bar above that 1103.75 level yet.
Also note the inability to close a bar below 1100 today so far.
I'll be travelling next week. Hope you all have a good one.
Notice how they can't close a bar above that 1103.75 level yet.
Also note the inability to close a bar below 1100 today so far.
I'll be travelling next week. Hope you all have a good one.
Click image for original size
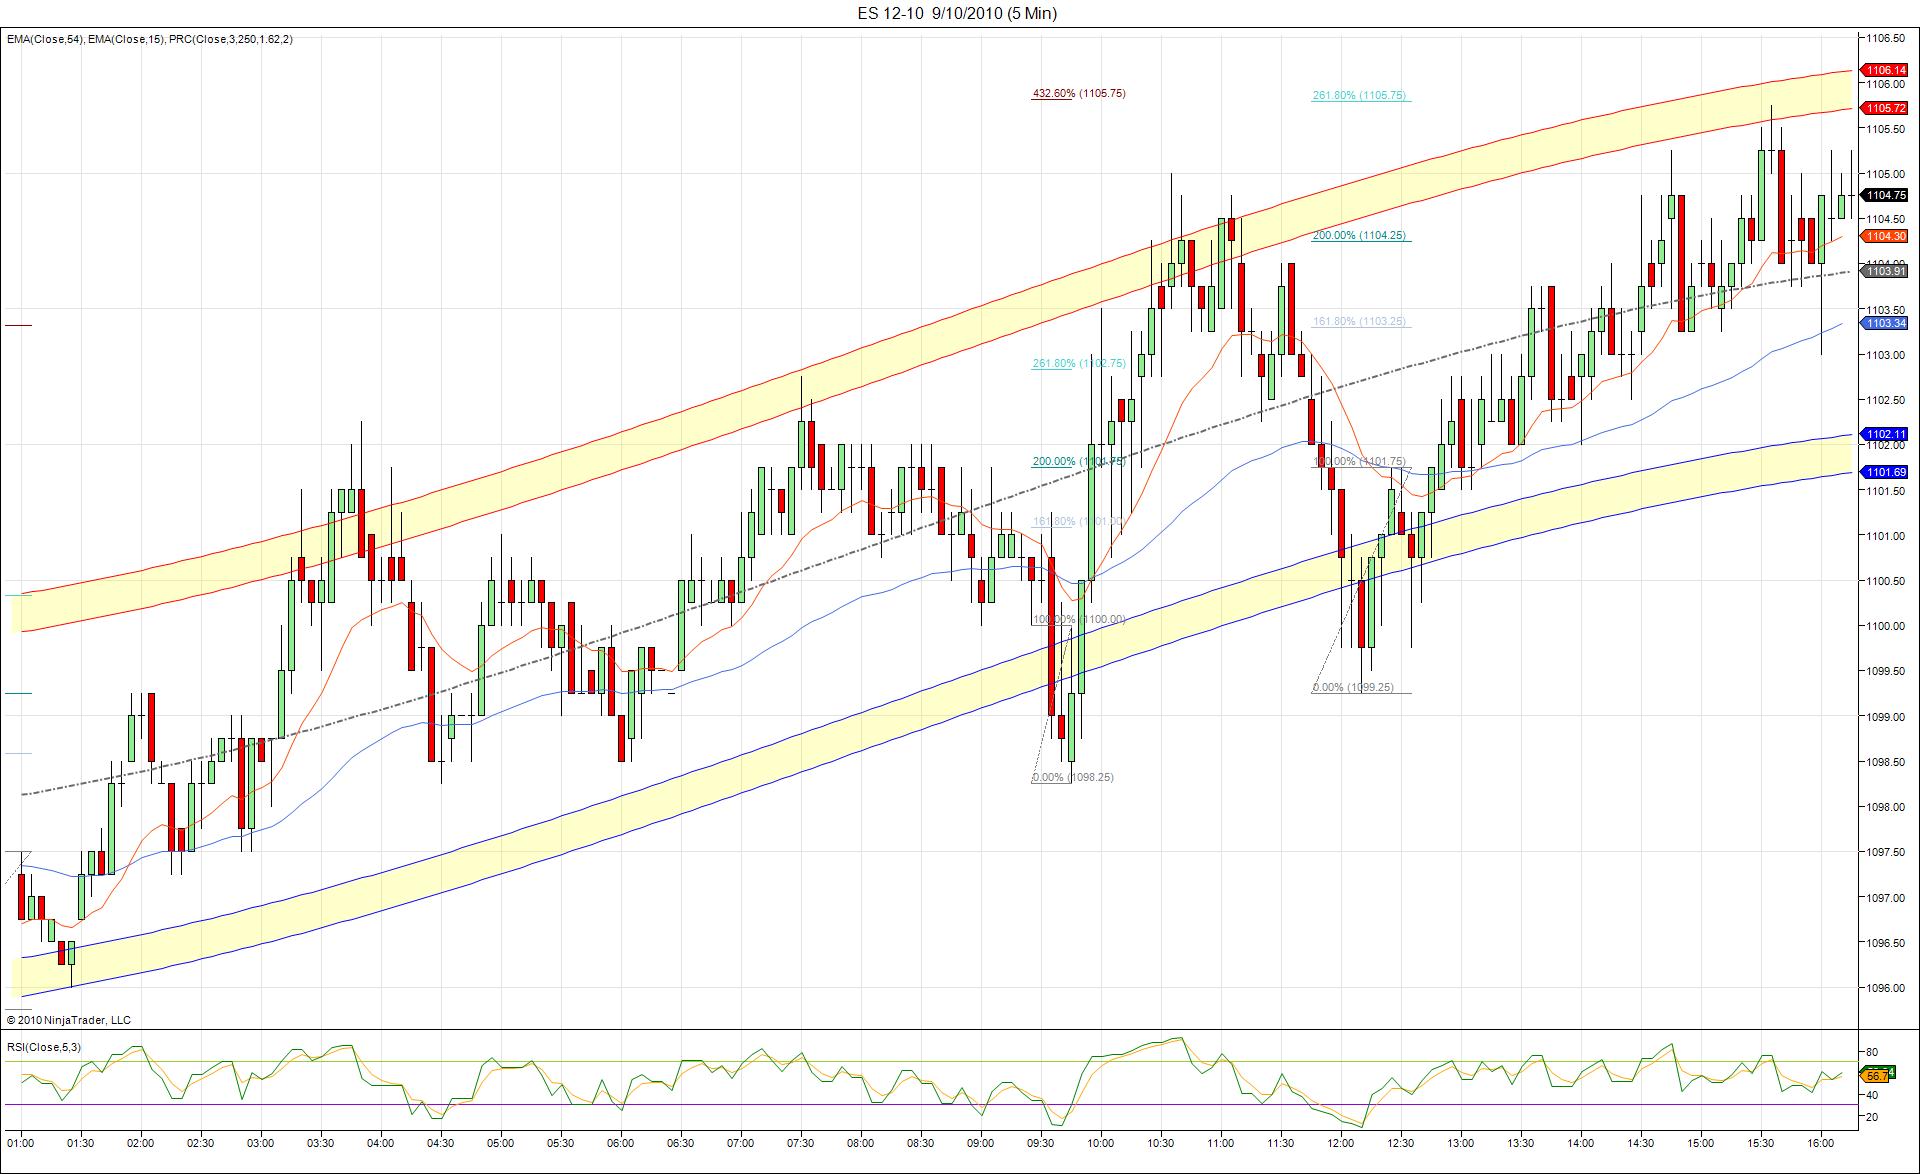
Thought everyone might find this interesting. 5-min chart with two separate fib projections at 1105.75....top tick for the day.
Click image for original size
Emini Day Trading /
Daily Notes /
Forecast /
Economic Events /
Search /
Terms and Conditions /
Disclaimer /
Books /
Online Books /
Site Map /
Contact /
Privacy Policy /
Links /
About /
Day Trading Forum /
Investment Calculators /
Pivot Point Calculator /
Market Profile Generator /
Fibonacci Calculator /
Mailing List /
Advertise Here /
Articles /
Financial Terms /
Brokers /
Software /
Holidays /
Stock Split Calendar /
Mortgage Calculator /
Donate
Copyright © 2004-2023, MyPivots. All rights reserved.
Copyright © 2004-2023, MyPivots. All rights reserved.