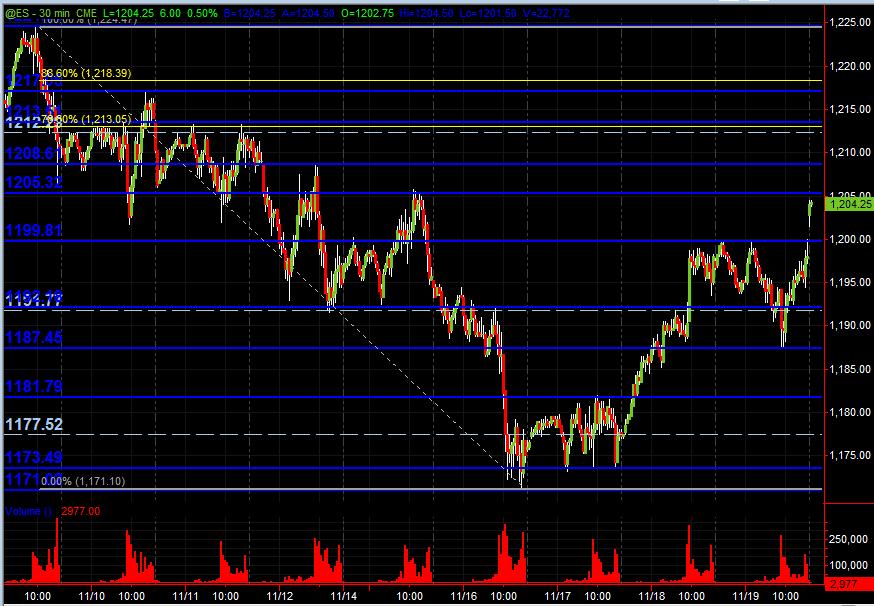
Here’s what I’m looking at with S/R levels using a 30-minute ES chart … Blue lines PASR, dashed White lines Wkly Pvts and Yellow lines are Fib retracements from recent highs. These are the levels of what I’m looking at coming into Monday’s trading. ES is currently trading up into the 1205 (minor) PSAR resistance zone for now at 6pm Central Time. Hope this is useful as a MAP for trading.
1217-1218.25 PASR resistance and Fib 886 retracement
1212.25-1213.5 is PASR resistance and Wkly Pvt plus a Fib 786 retracement (higher significance)
1208.50 PASR resistance w/Daily S2 3 ticks away
1199-1200 PASR support
1191.75-1192.25 PASR support and Wkly Pvt and Daily S1 w/in a few ticks (higher significance)
1187.50 PASR support