MyPivots
Sign In
JA
jarek
Rep: 94
Posts: 3,474
This one-way market is already becoming boring. I'm more and more inclined to the following long term view:

Click image for original size
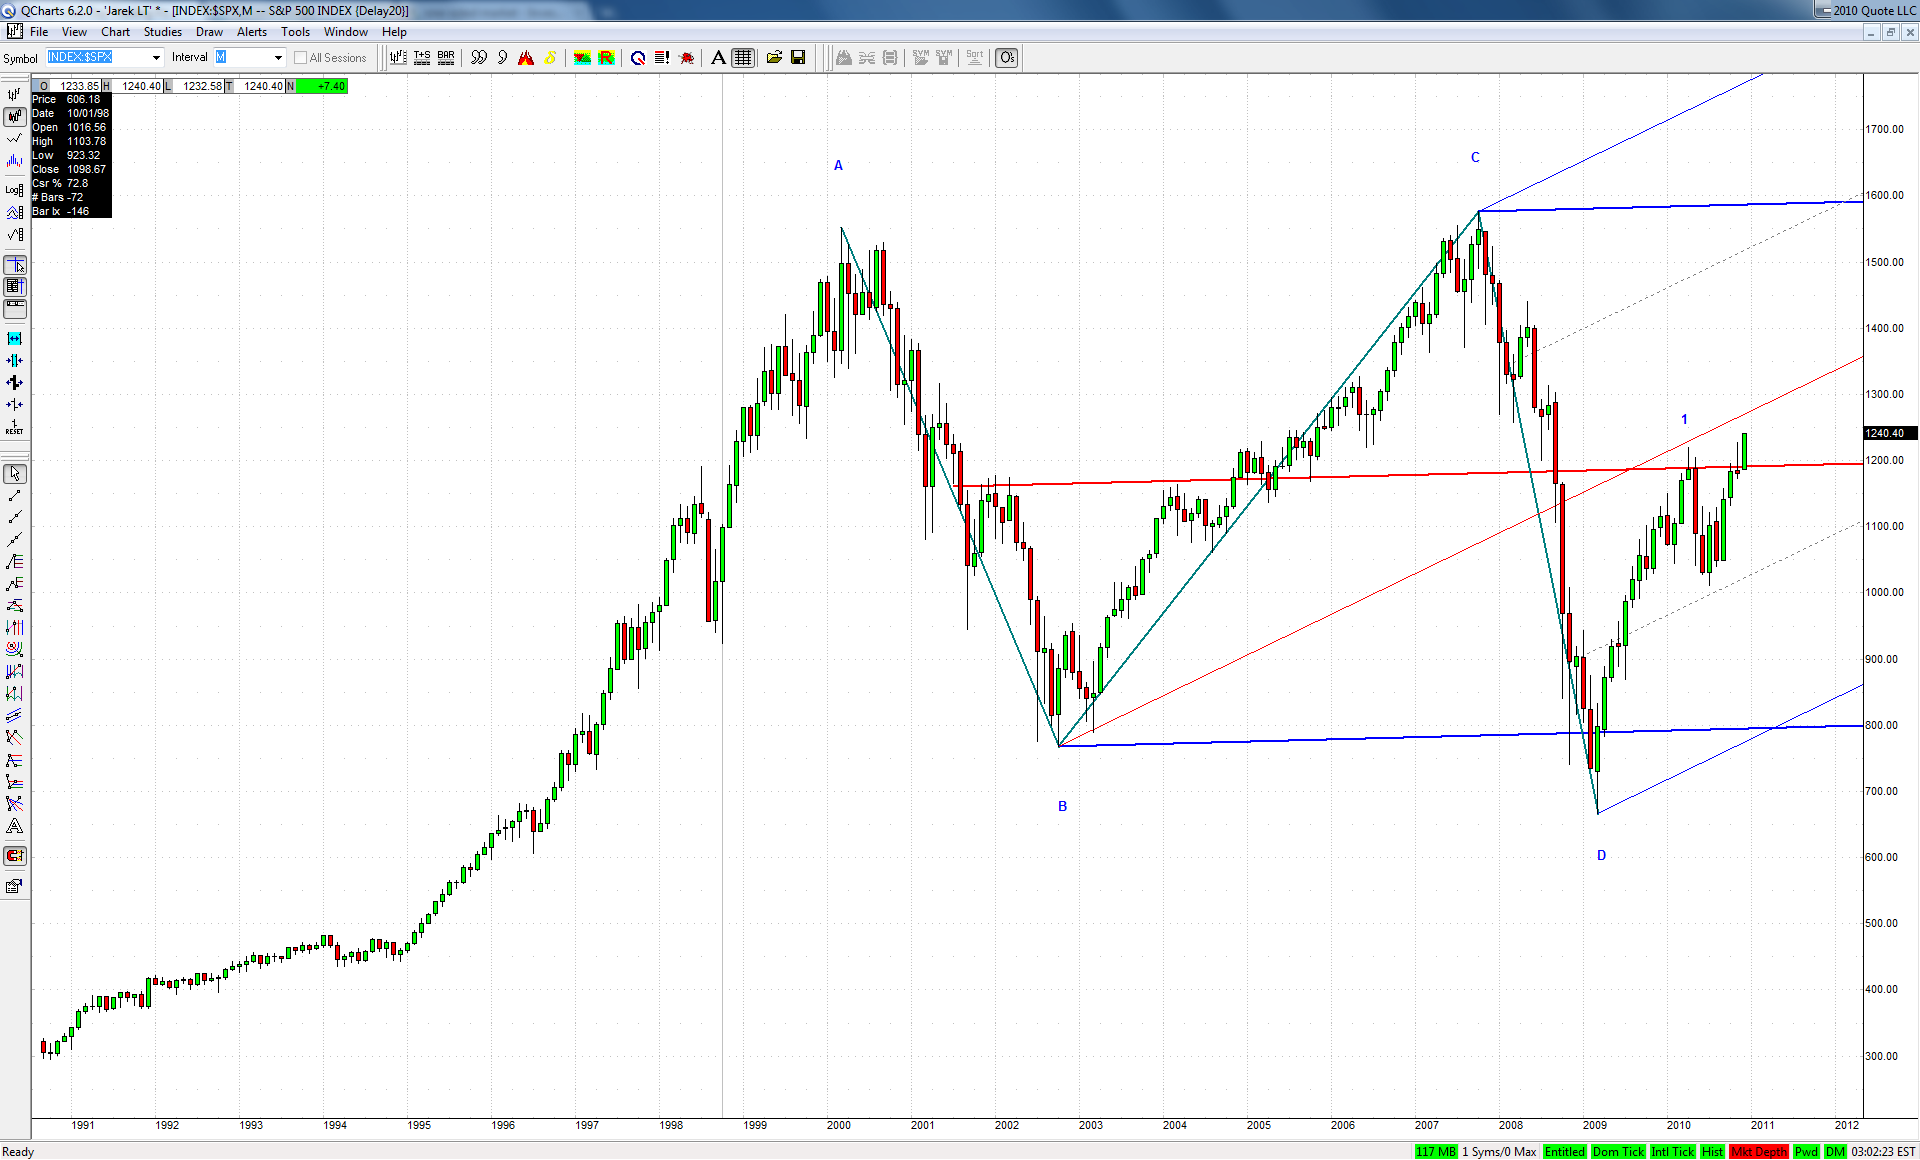

The only question mark in such scenario would be whether it was already end of .382 W2 at July lows or if it still needs some more downside to conclude (and form a Flat or TD ABCD).
I agree with Jim that longer term all the permabears are going to be rather unpleasantly surprised.
JA
jarek
Rep: 94
Posts: 3,474
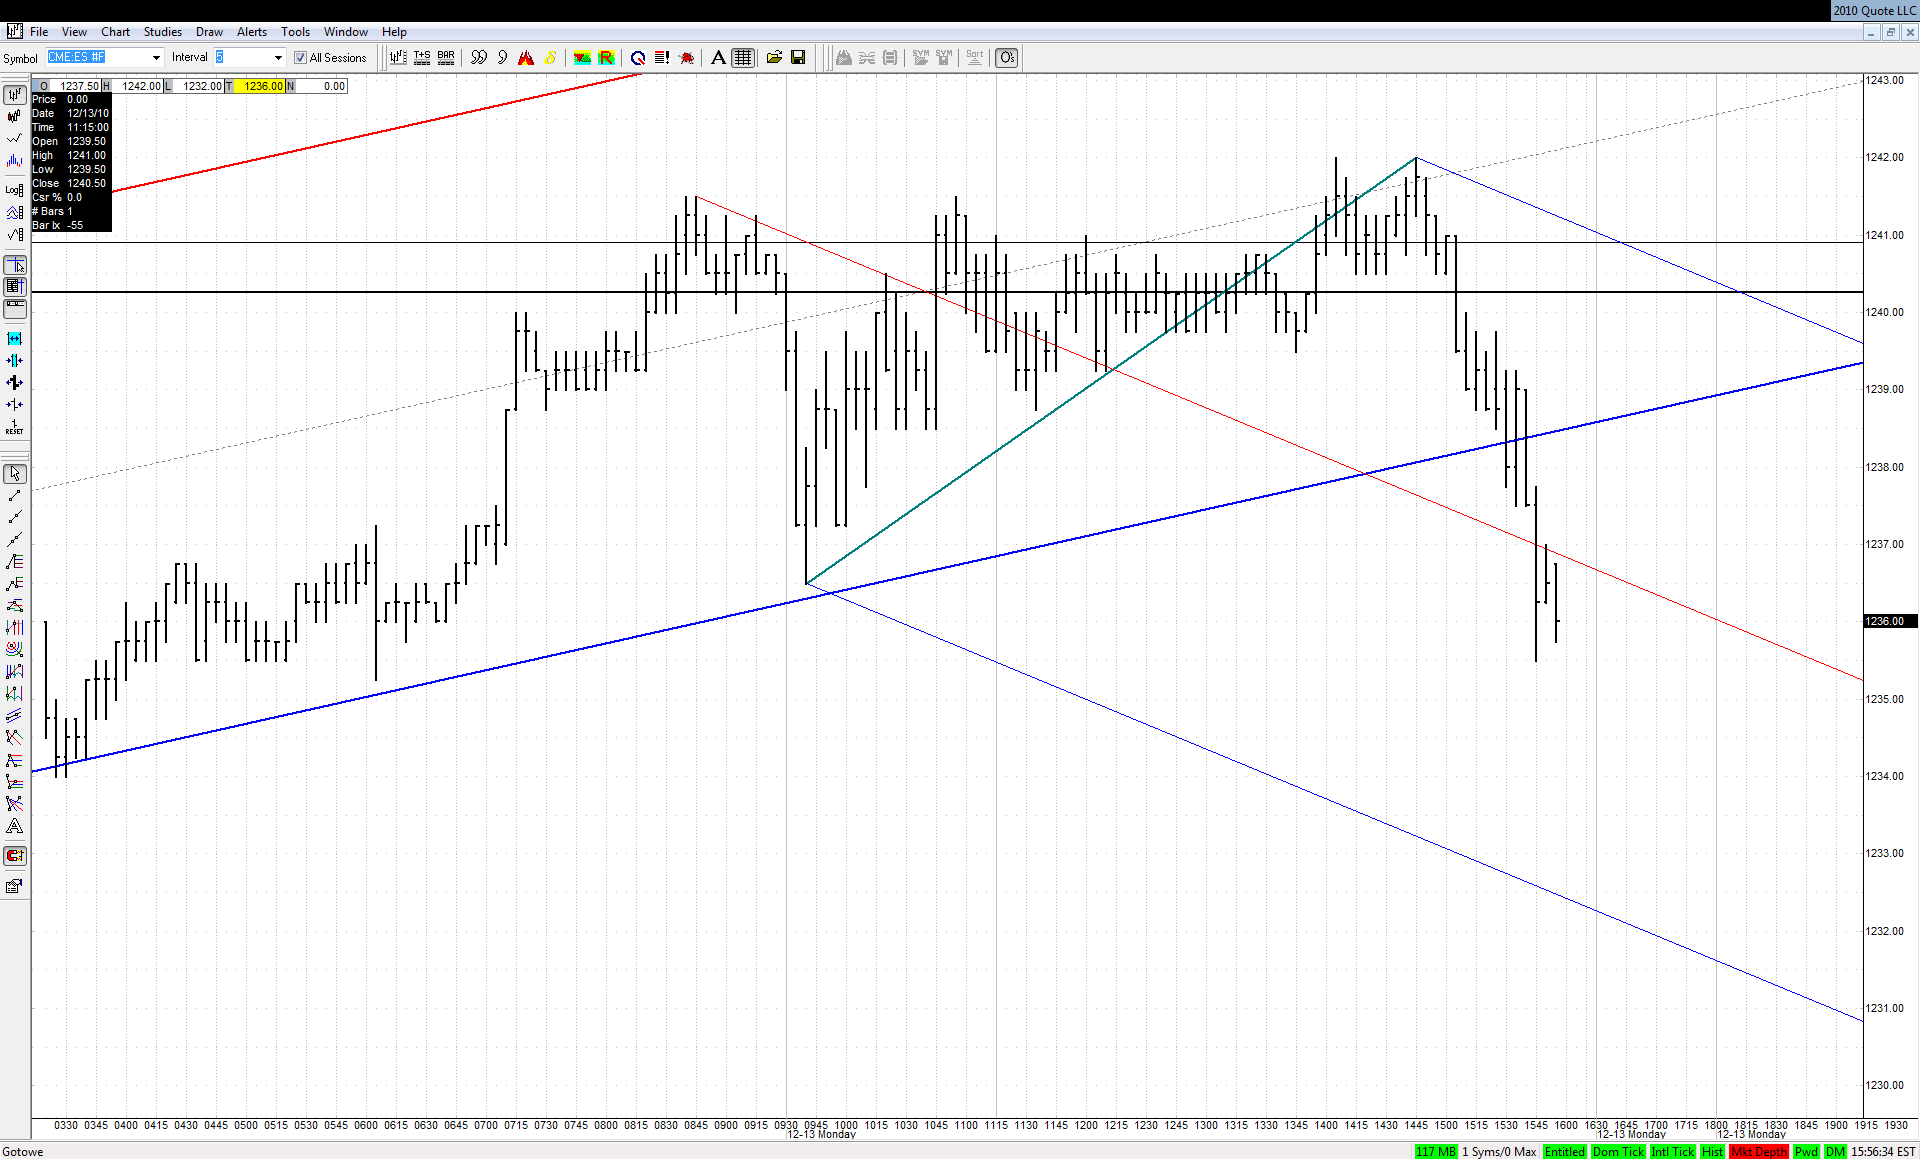
The recent small bounce looks just like a checkback of the downsloping ML. We know what the next target is:

Click image for original size
JA
jarek
Rep: 94
Posts: 3,474
In fact this is a green set:


Click image for original size
JI
jimkane
Rep: 3,058
Posts: 33,089
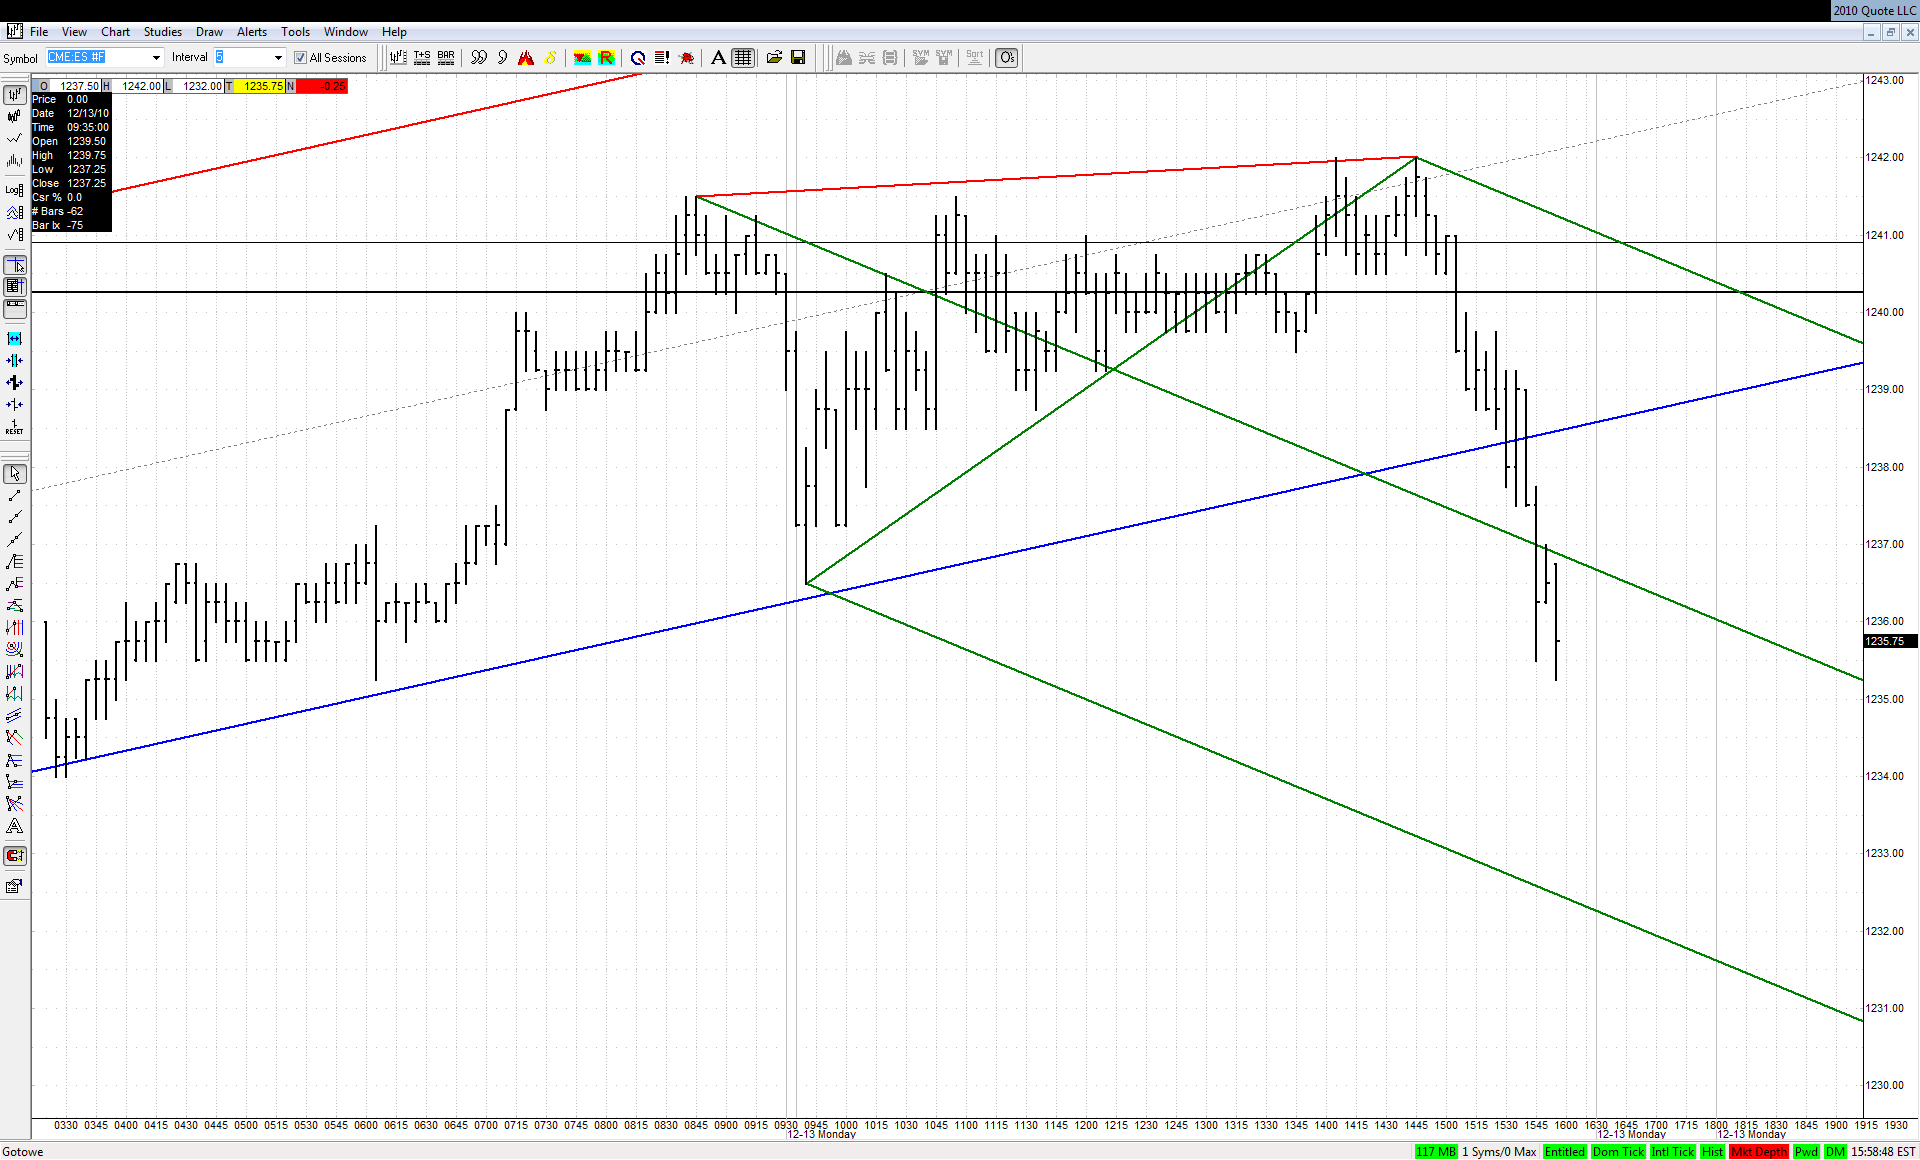
I want to see if it breaks down more in after cash. But, lo and behold, recall my latest theory, where did they close cash? Just about dead on the key area, complete with a little scare fake to the downside. I think there is something to that theory.
RO
roofer
Rep: 3,689
Posts: 3,574
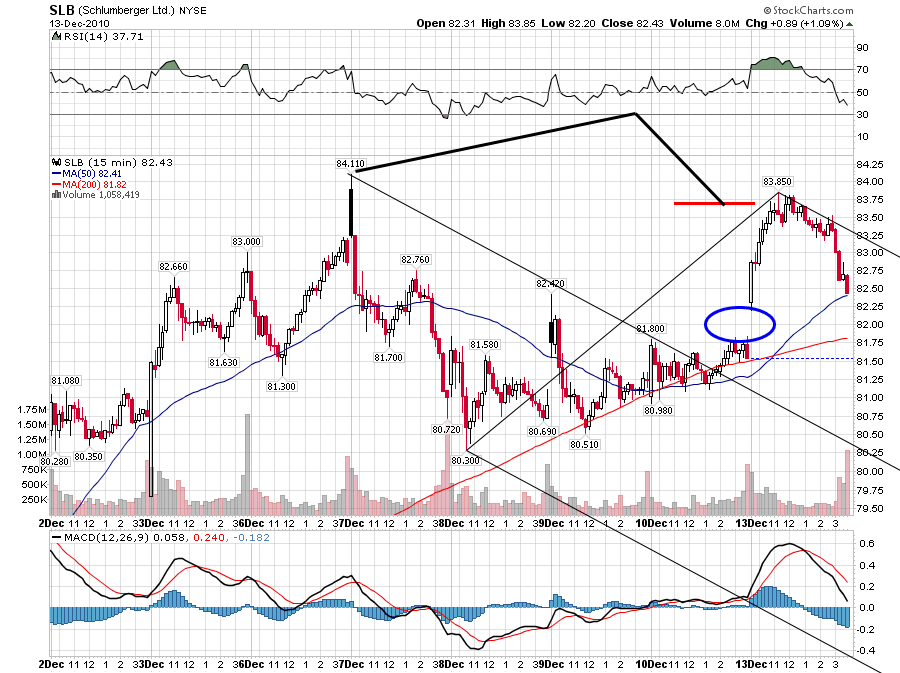
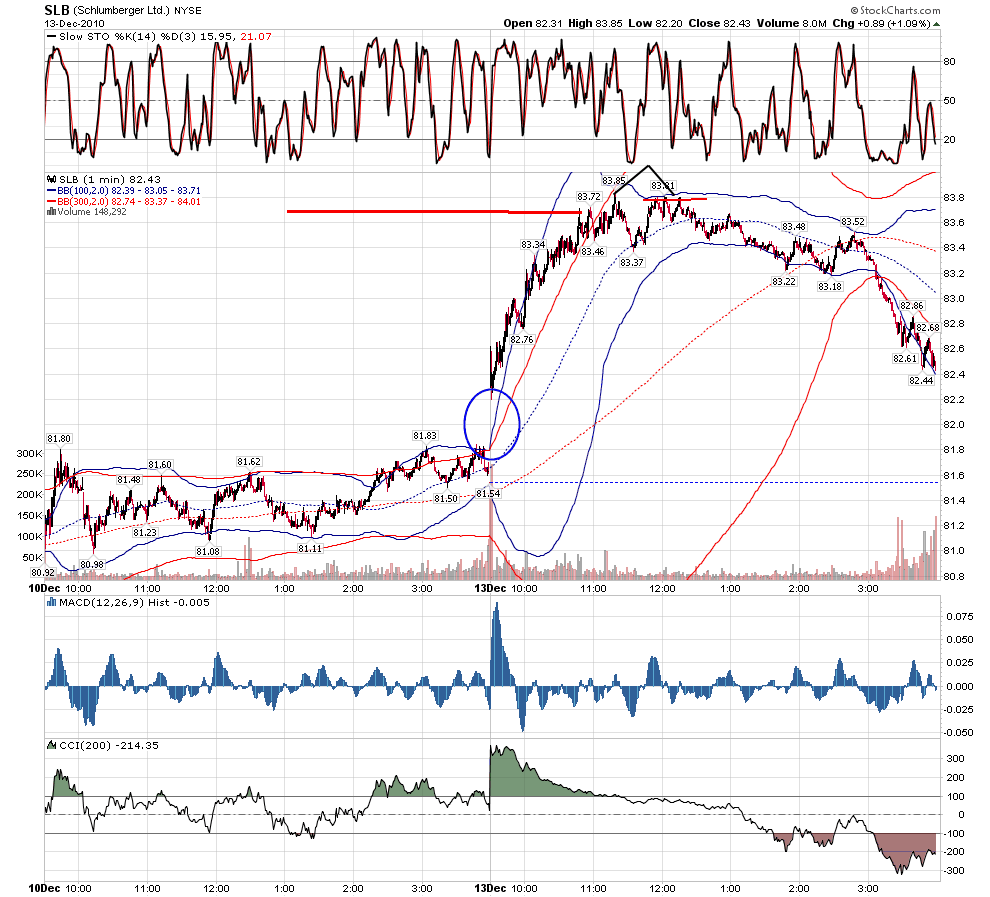
my bread and butter is .886 on gap on 5...but the REAL edge is when it sets up with the geometry... many energy stocks rushed to the dance this morning...note how SLB traded to larger .886.... but i had no geometry on that thrust.... that leaves me with one option... to wait patiently for a retest at .886.... and there it was.... across the board, despite the snp and dia grinding higher, i had chart after chart saying at least in the VERY SHORT TERM, the computers wanted to take the market down.
Click image for original size

Click image for original size
JI
jimkane
Rep: 3,058
Posts: 33,089
Good stuff, roofer. Looks like we both read that HOD right on. Glad to see you back posting.
RO
roofer
Rep: 3,689
Posts: 3,574
as always, i just like being short... i am not reading a whole lot into today... as price racheted down in late 2008, there were many late day rallies driven by similar geometry as today....as i was getting my trades off all day, i remembered a similar day in reverse and wondered if sds would bottom on 1.27/1.127... and there it was...
RO
roofer
Rep: 3,689
Posts: 3,574
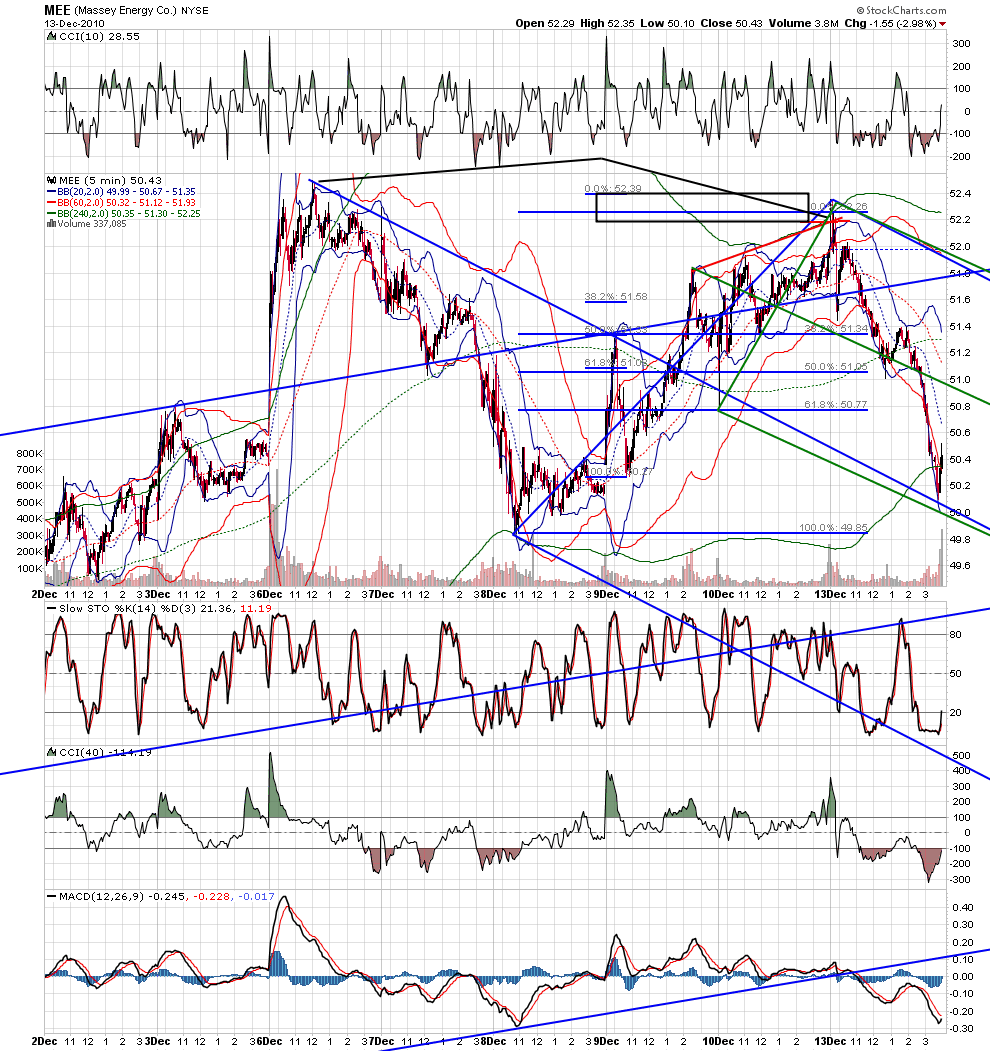
chart after chart had geometry of sell.... and then hit target....
Click image for original size
RO
roofer
Rep: 3,689
Posts: 3,574
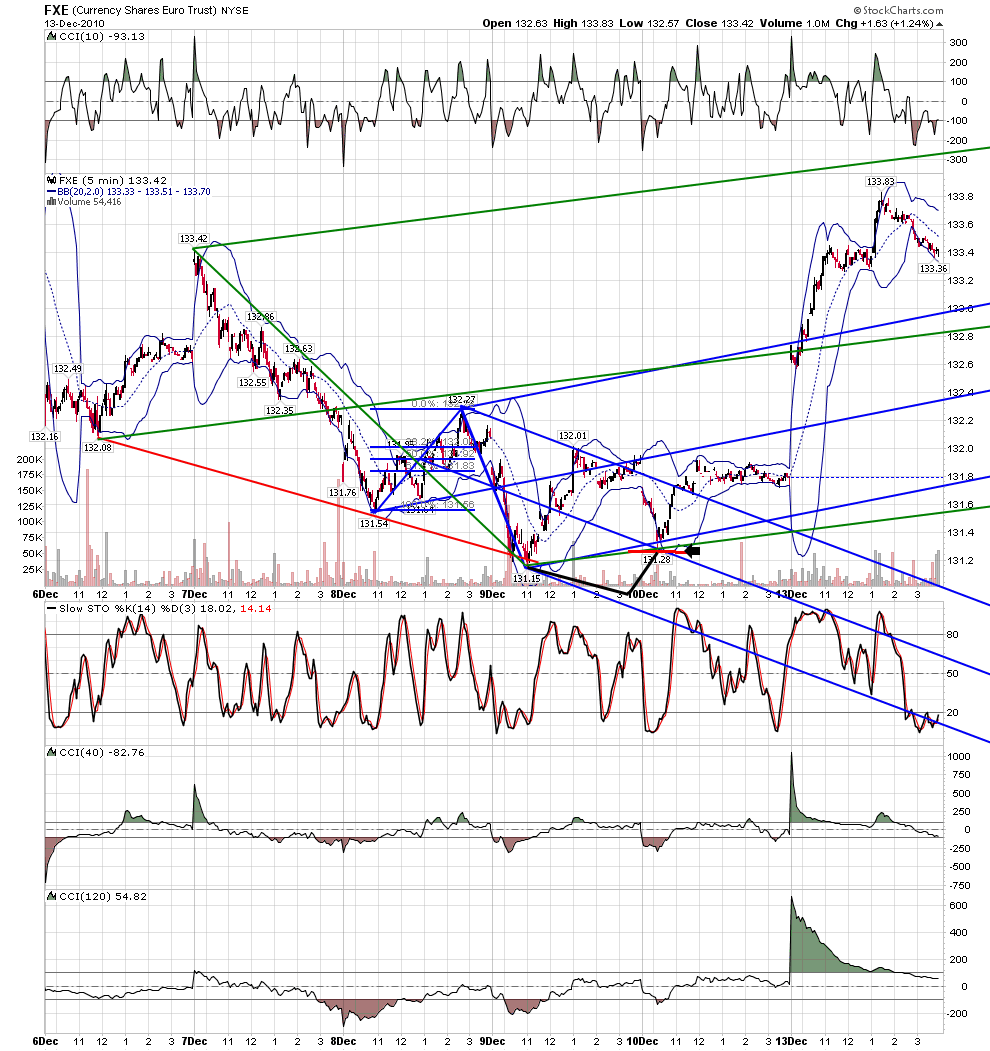
i have to chuckle...i saw some one was looking for joed and me at an fx forum in the medianline thread... so i made one post about how my work honors old and new and how95% of my trades are based on .886 on gap... in other words i gave them my best stuff.so today they are scratching their heads wondering how anyone? caught the rocket shot in the euro...we here would say... what the hell did you expect given the geo-metry
Click image for original size
JI
jimkane
Rep: 3,058
Posts: 33,089
I think gold is clearly deciding it doesn't want to roll down off that bearish pattern jarek was showing, with the break of all those highs in a rocket launch. Then again, who could be bearish on gold right now... I would like to see an update to that chart, jarek, if you would please.

I'll be watching, though, to see if this was a lower degree 'wave 4' and 'wave 5' in the general area of the setup.
RO
roofer
Rep: 3,689
Posts: 3,574
note on .886...the computers are hitting the trade so relentlessly that they are often ''jumping the trade''...on a practical level i am dealing with this on 2 levels...i am boxing price... ie. on stocks less than $100 i box it 5 cents either way... on stocks over $100 ( ibm,fxe, gs,etc.) i box 10 cents and on aapl i box 20 cents.... when i am looking to trade, i have trade set and when price enters box i hit market.
JI
jimkane
Rep: 3,058
Posts: 33,089
Probably just some OpEx thing.