MyPivots
Sign In
JA
jarek
Rep: 94
Posts: 3,474
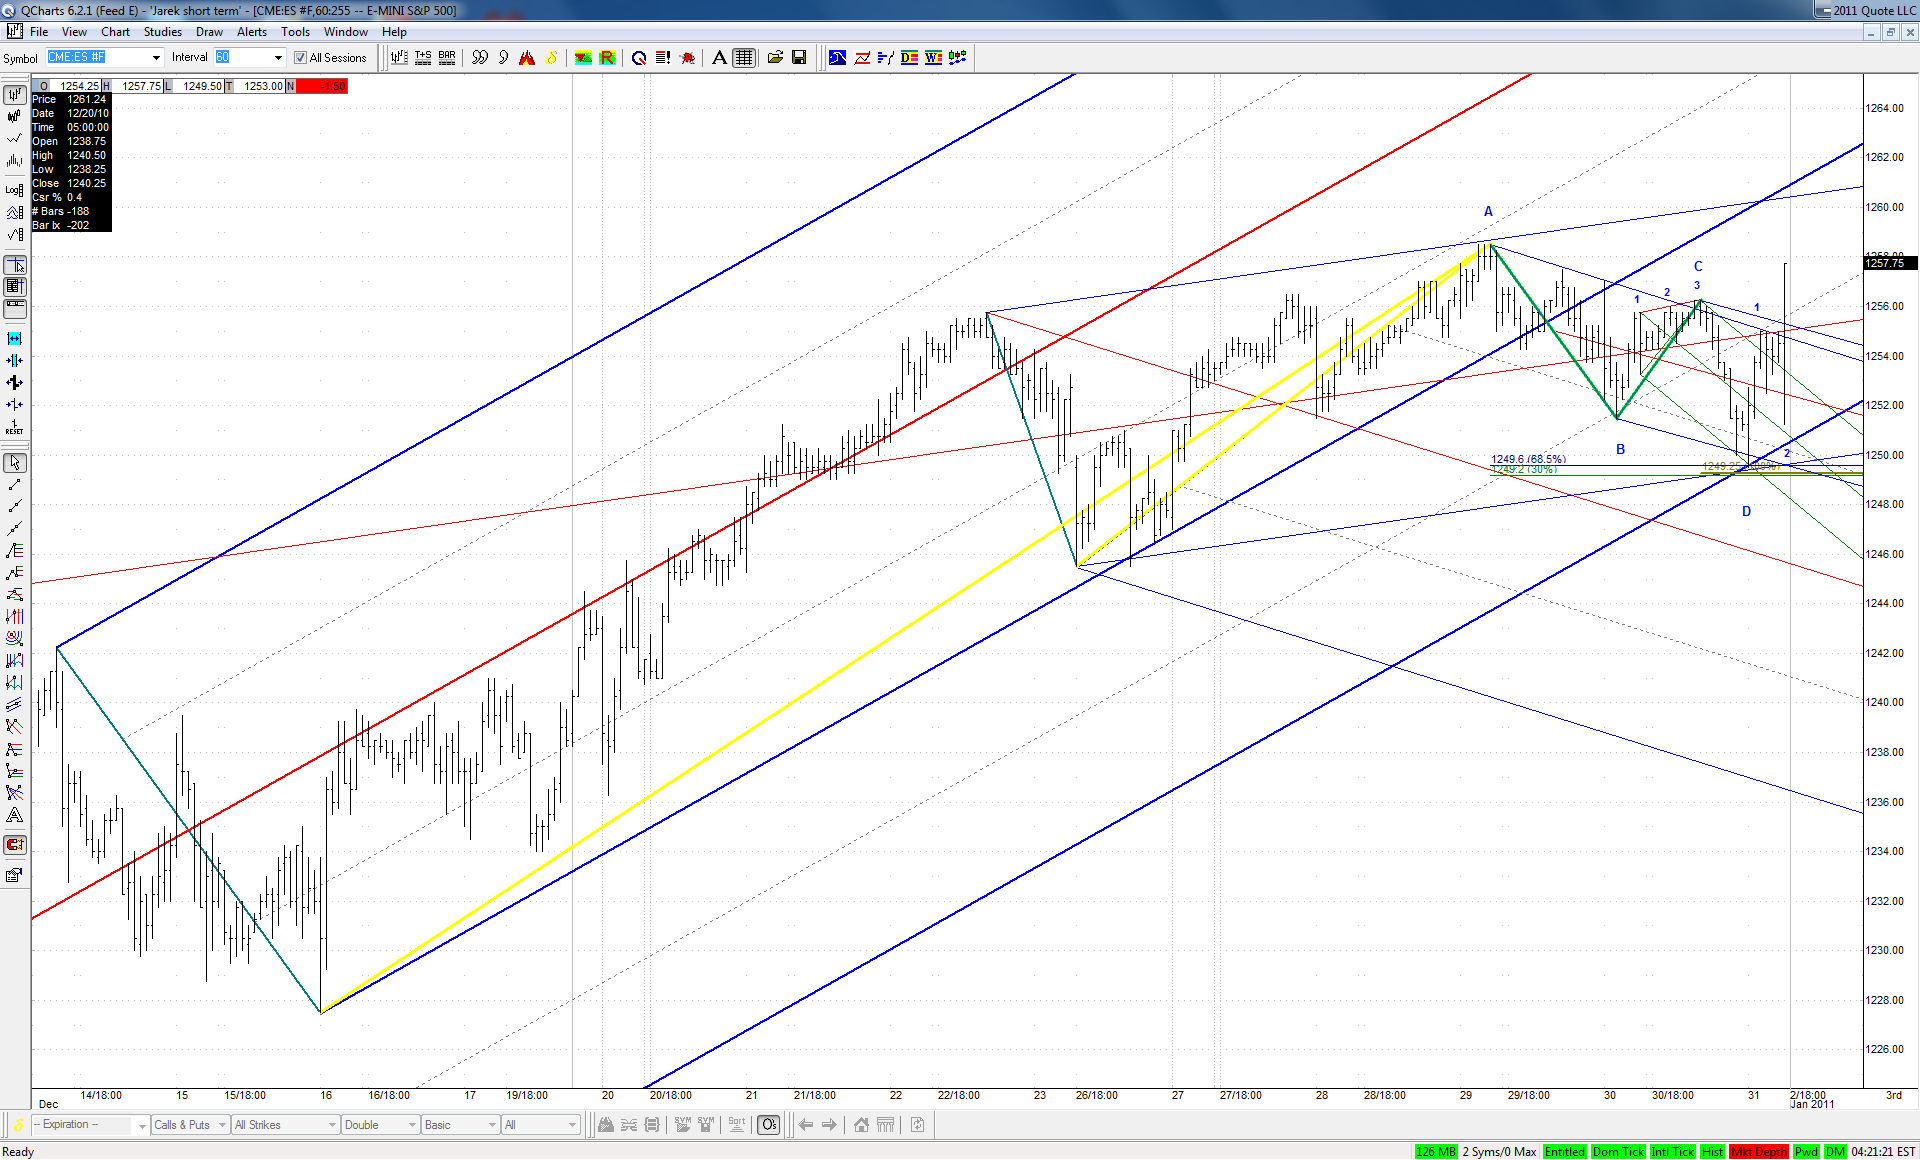
In the final hours or even minutes of 2010 trading the bulls proved one more time who was really in power last year:


Click image for original size


Click image for original size


Click image for original size
JA
jarek
Rep: 94
Posts: 3,474
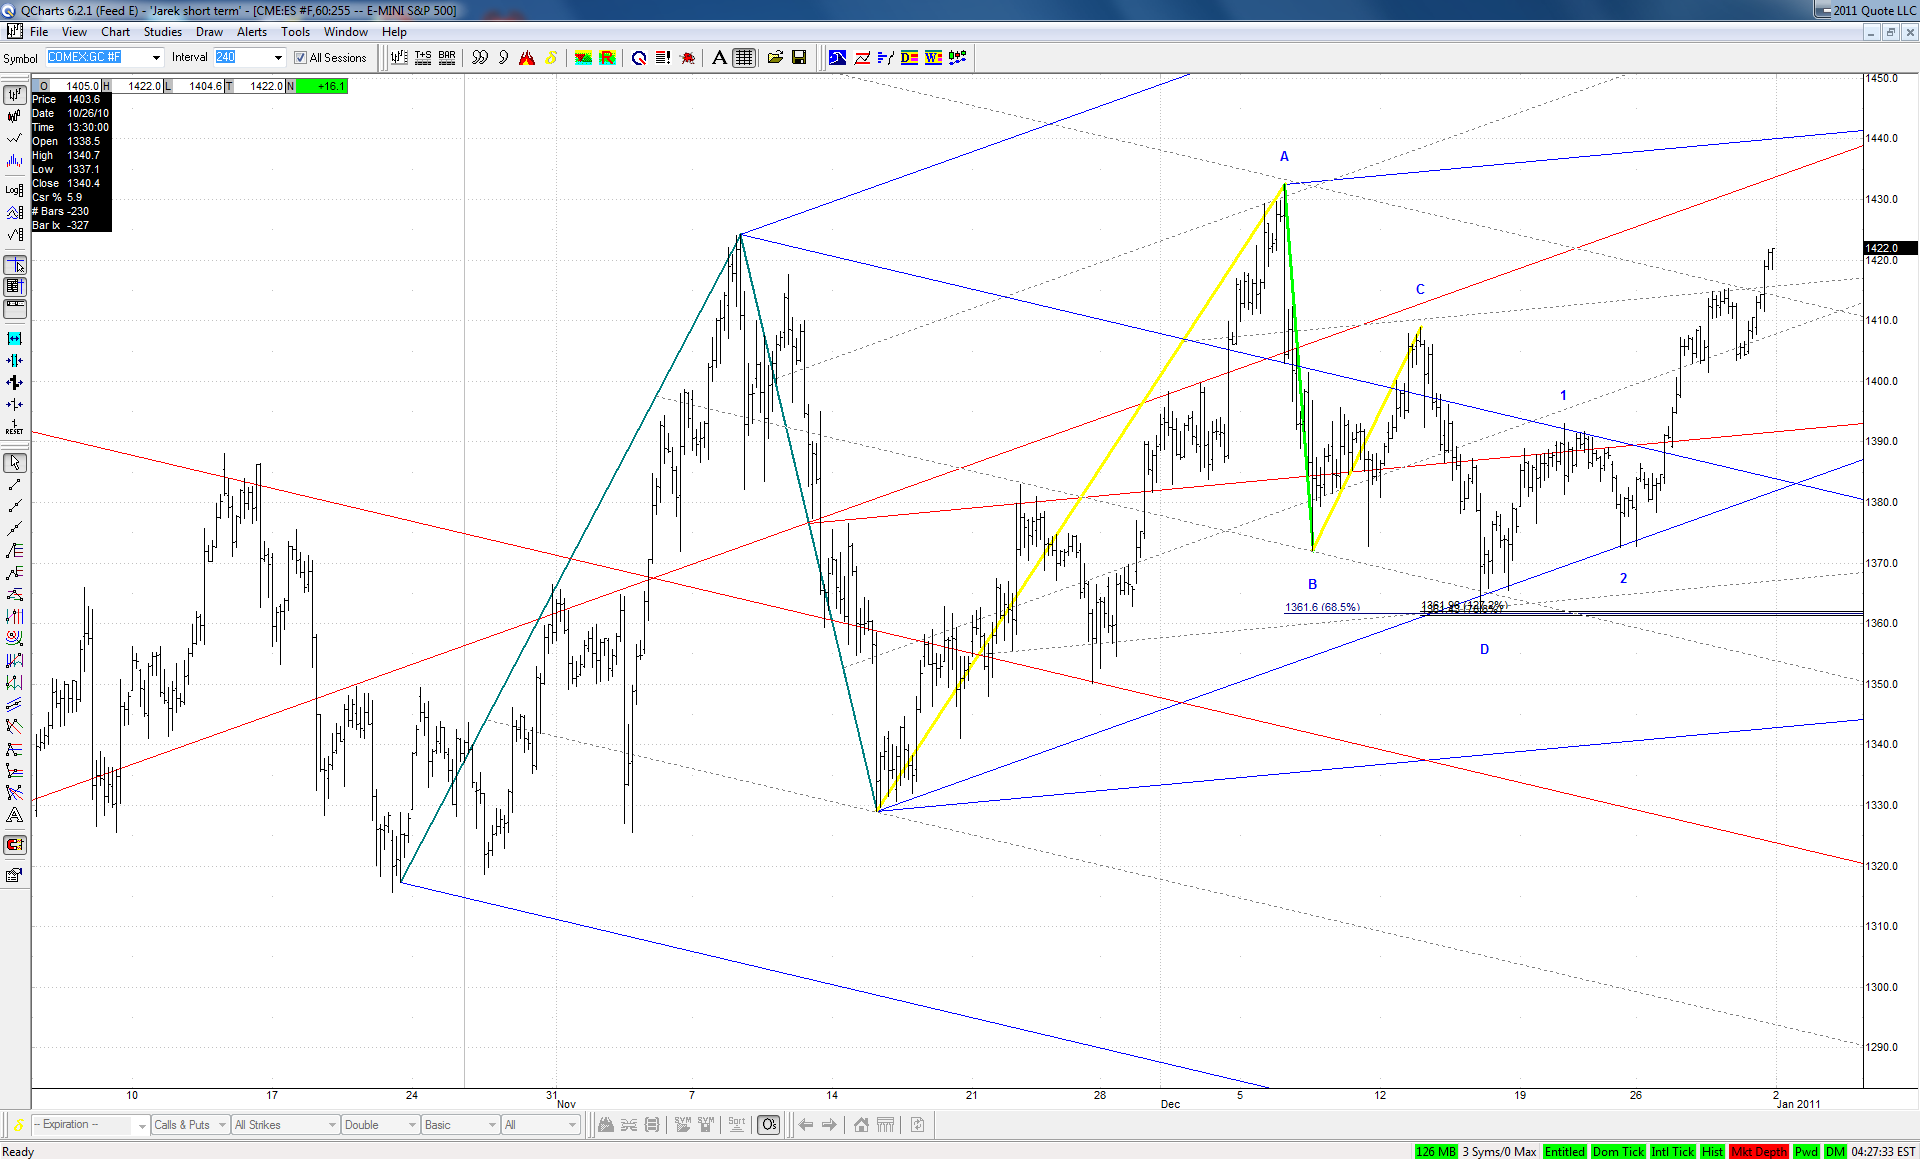
Gold was again repelled by same downsloping ML, this time strengthened by .382 of the recent drop:


Click image for original size
JA
jarek
Rep: 94
Posts: 3,474
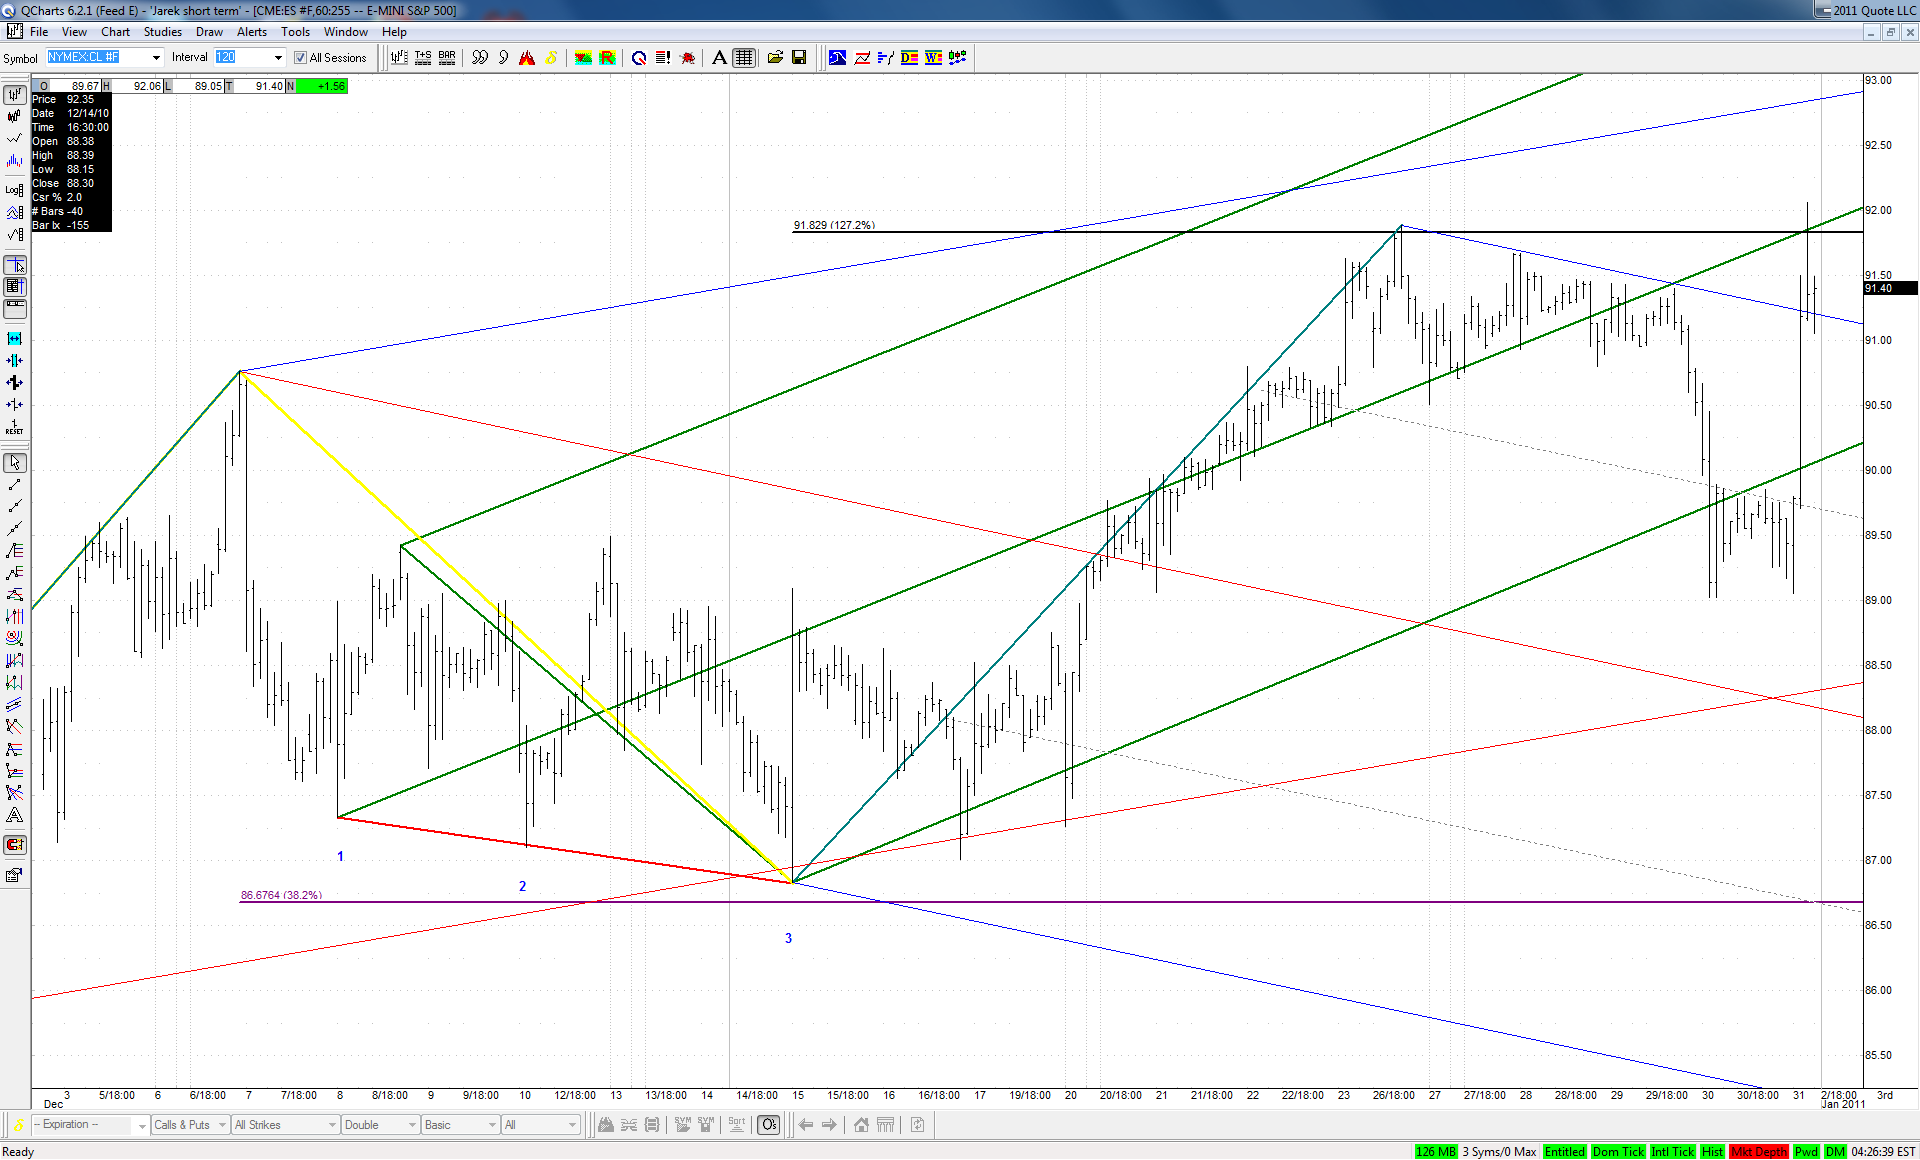
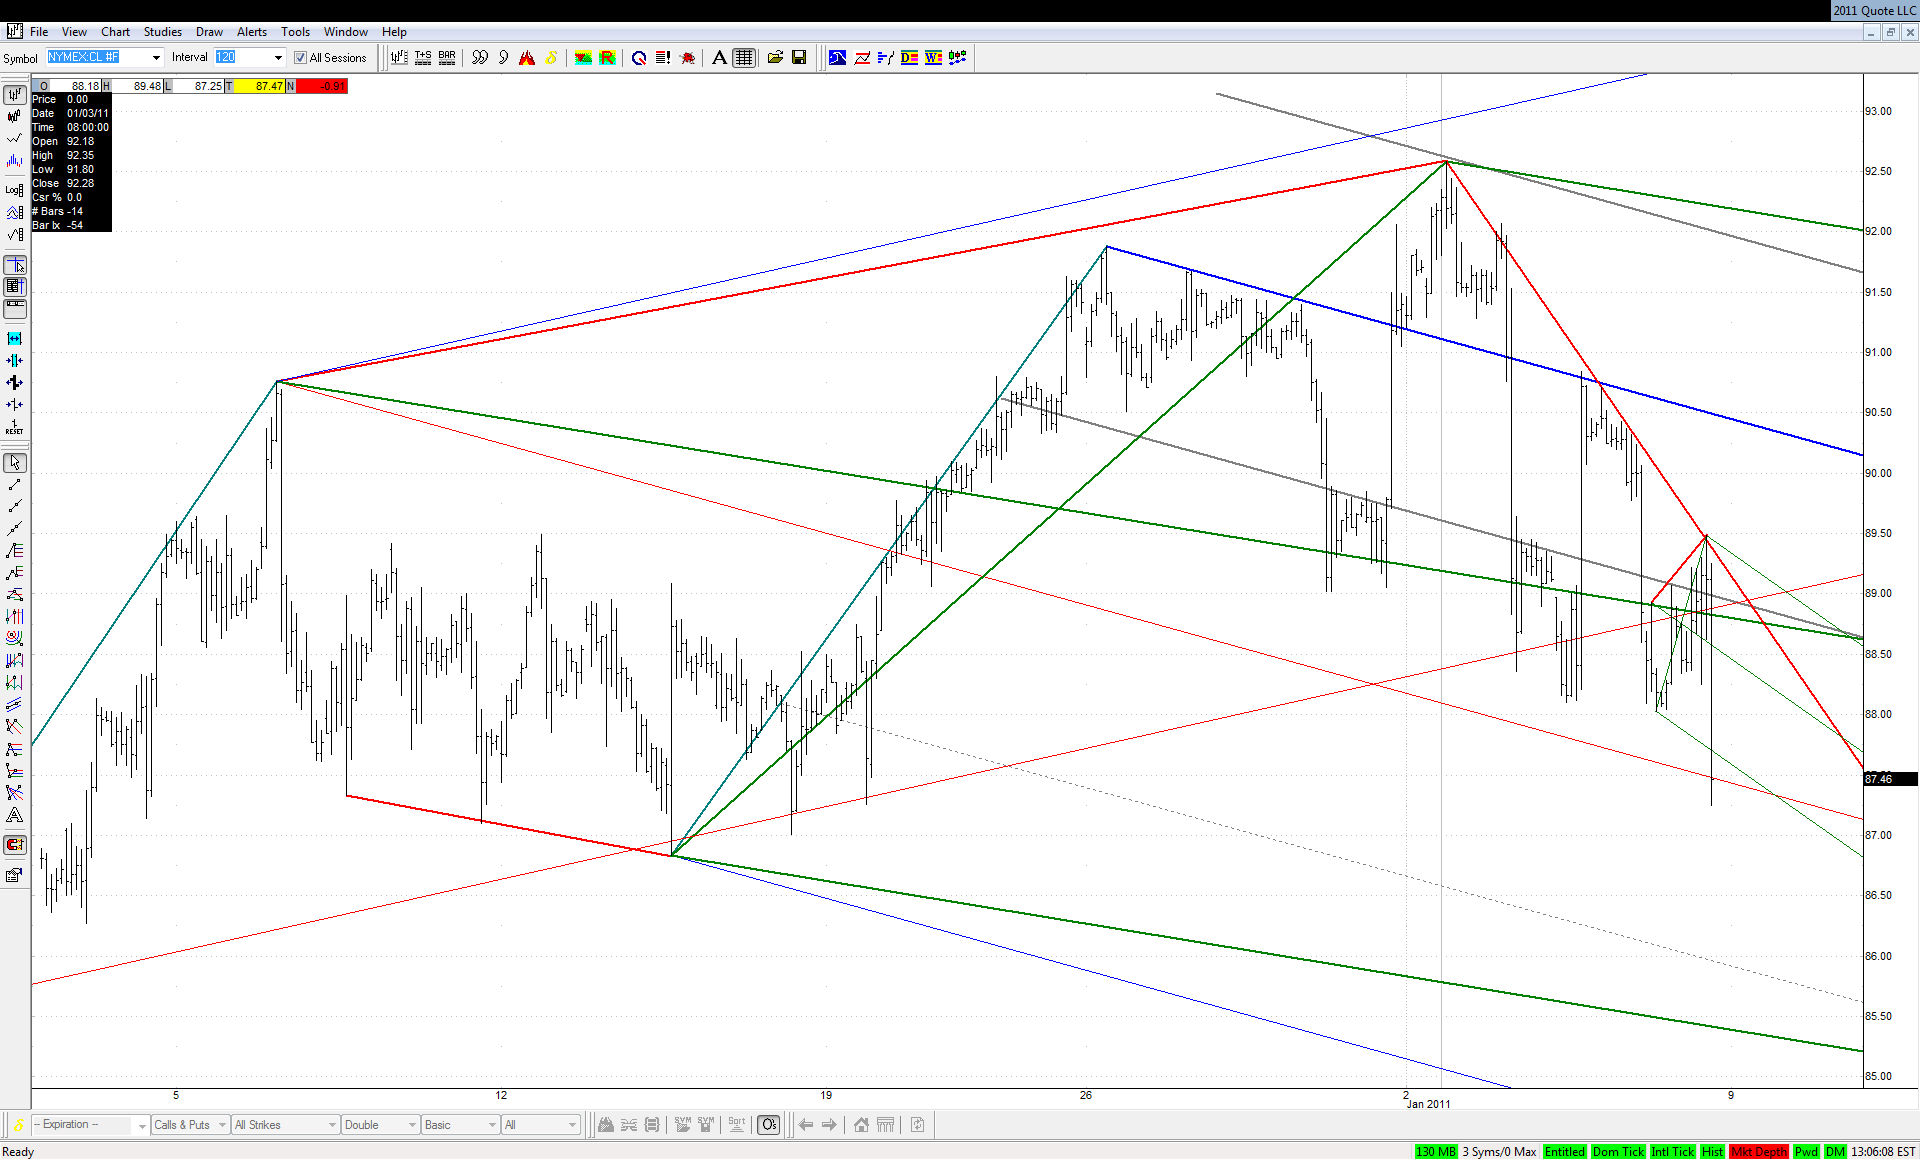
Crude accelerated nicely to the downside after hitting the spike line right at downsloping TL. The small green set played already to the lower ML, will the bigger one follow suit?


Click image for original size
RO
roofer
Rep: 3,689
Posts: 3,574
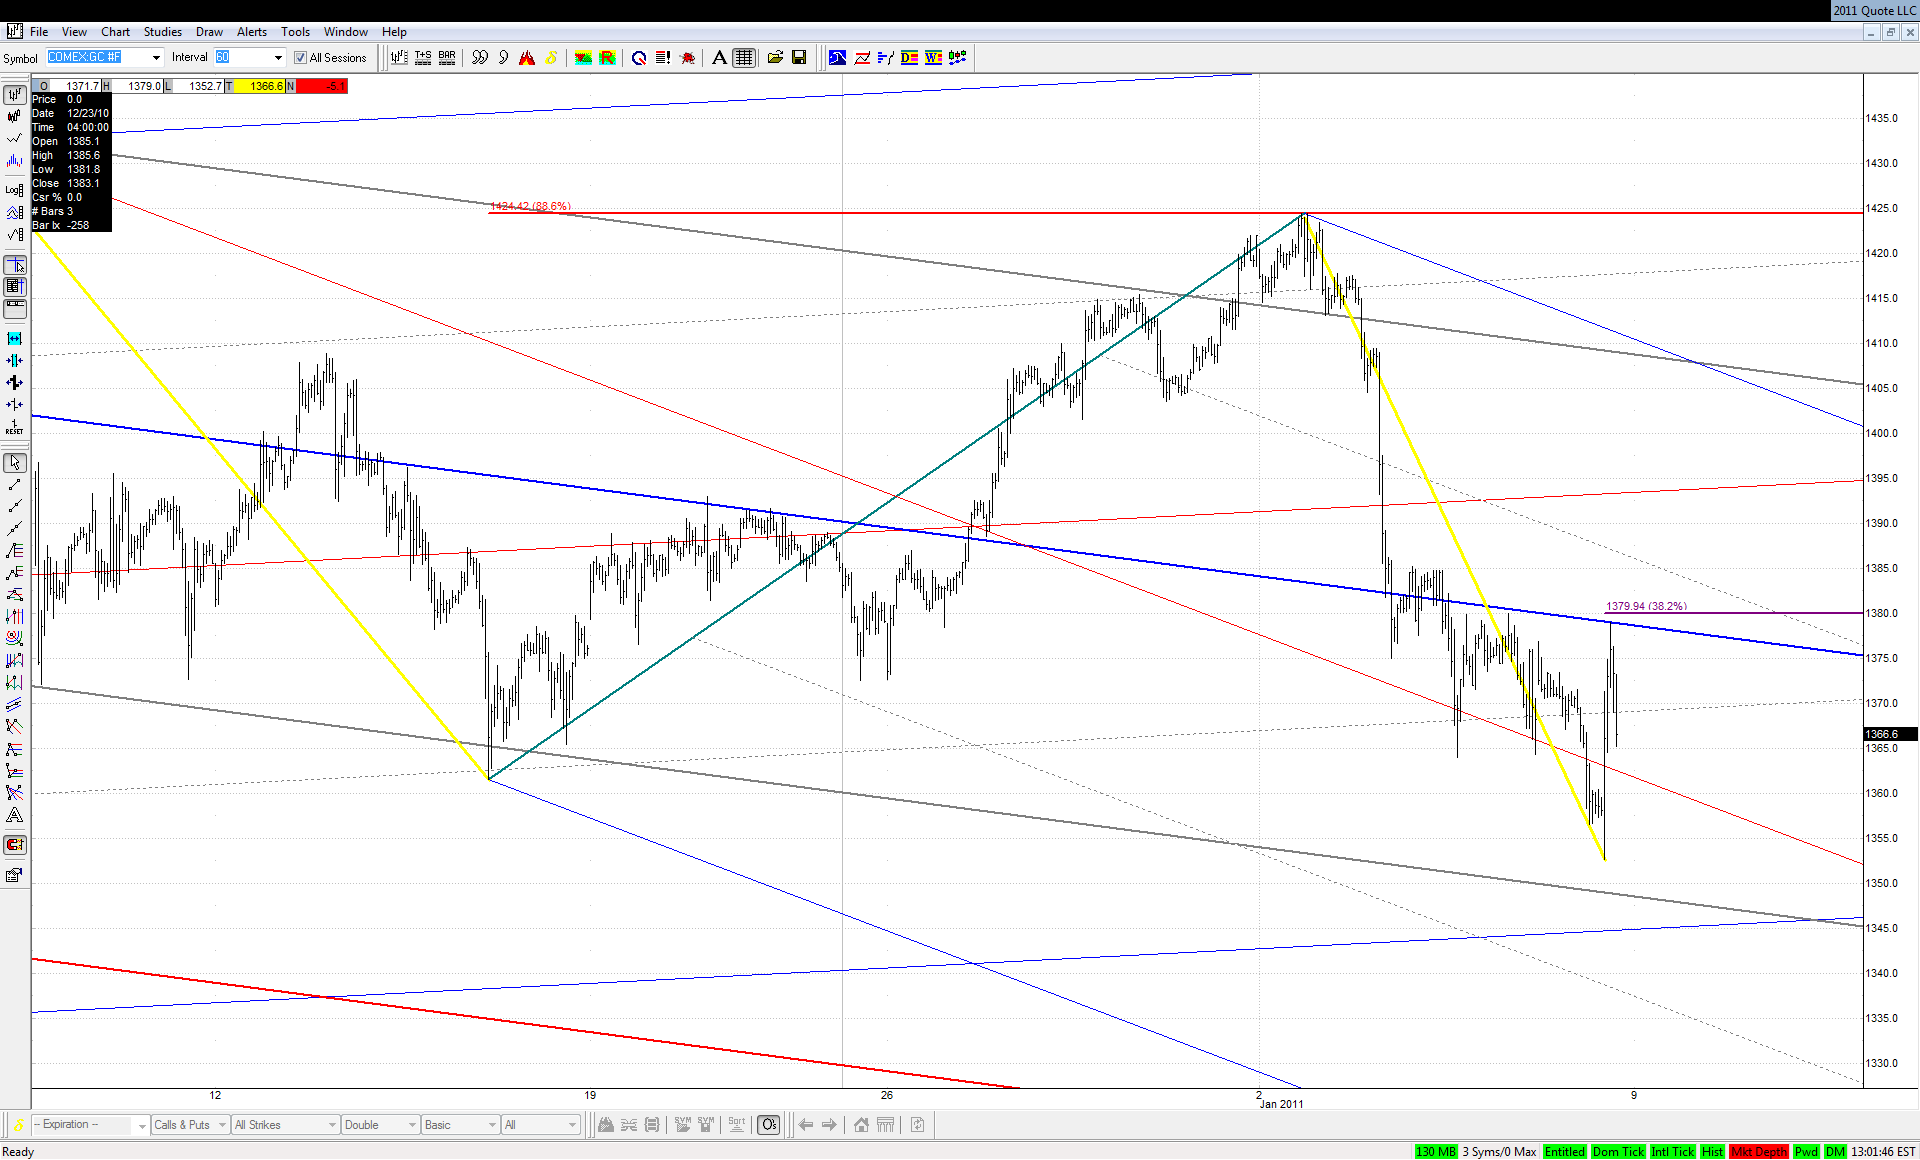
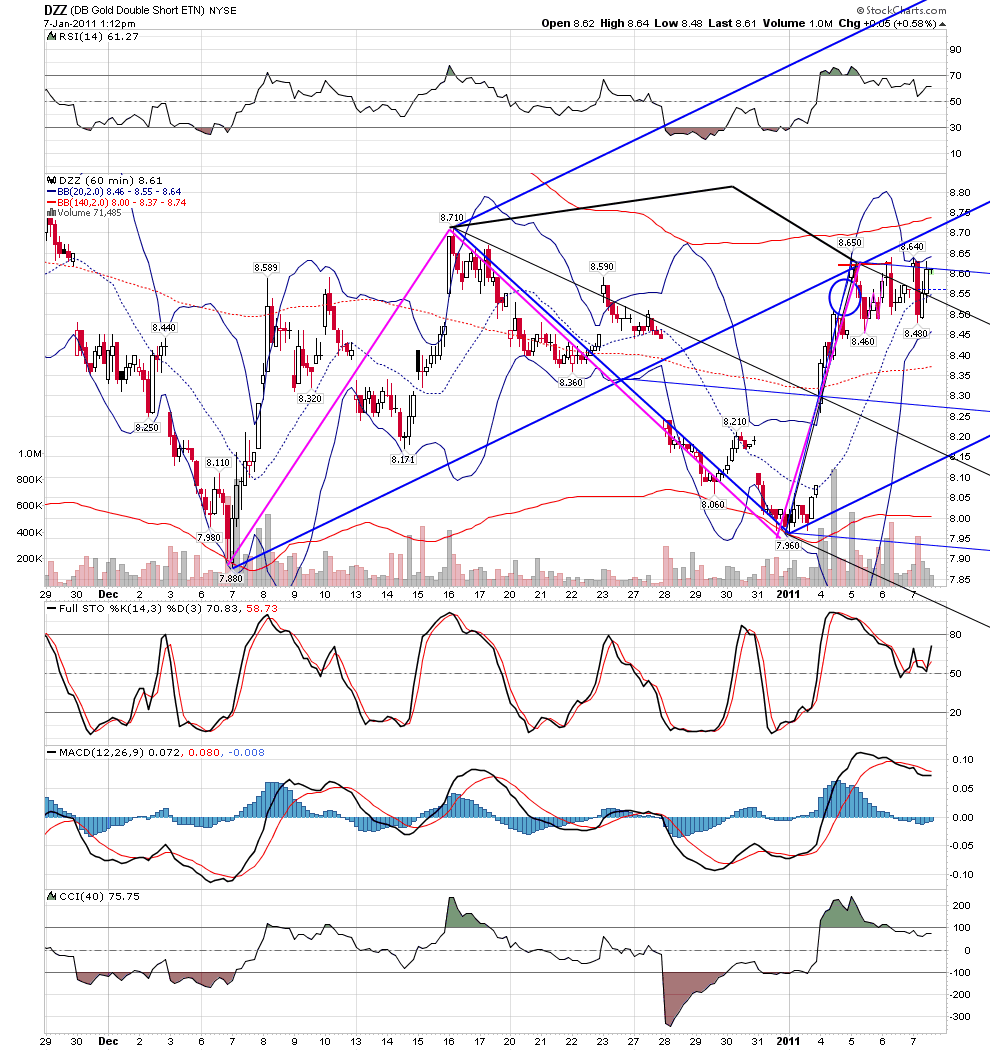
all seems quiet... but there is an epic tug of war going on in gold and gold stocks... when this moves it should be huge......
Click image for original size
RO
roofer
Rep: 3,689
Posts: 3,574
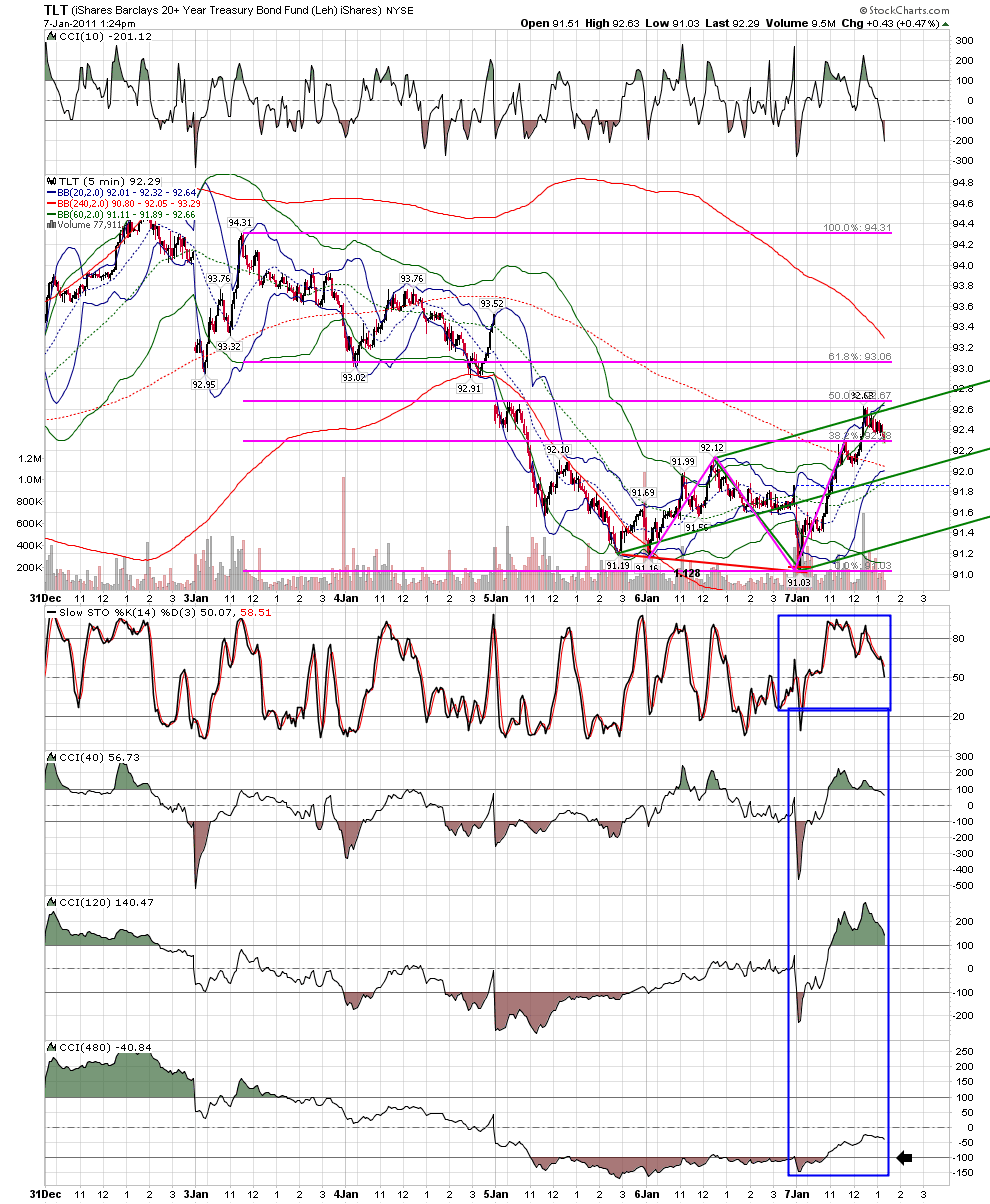
j- i was willing to take a trade long in bonds because of the implied odds of redline green set... time in the exact way the computers like to explode price was and is not in place with the geometry.....not quite.... what the want to see is the 40cci back to -100, the 120 backto 0 and the 480 ''kiss'' the-100 with geometry.. perhaps a kane abcd at line...
Click image for original size
JA
jarek
Rep: 94
Posts: 3,474
Good to know some details on your approach to CCI. Some people trade solely on CCI signals, so there has to be some merit to this
JA
jarek
Rep: 94
Posts: 3,474
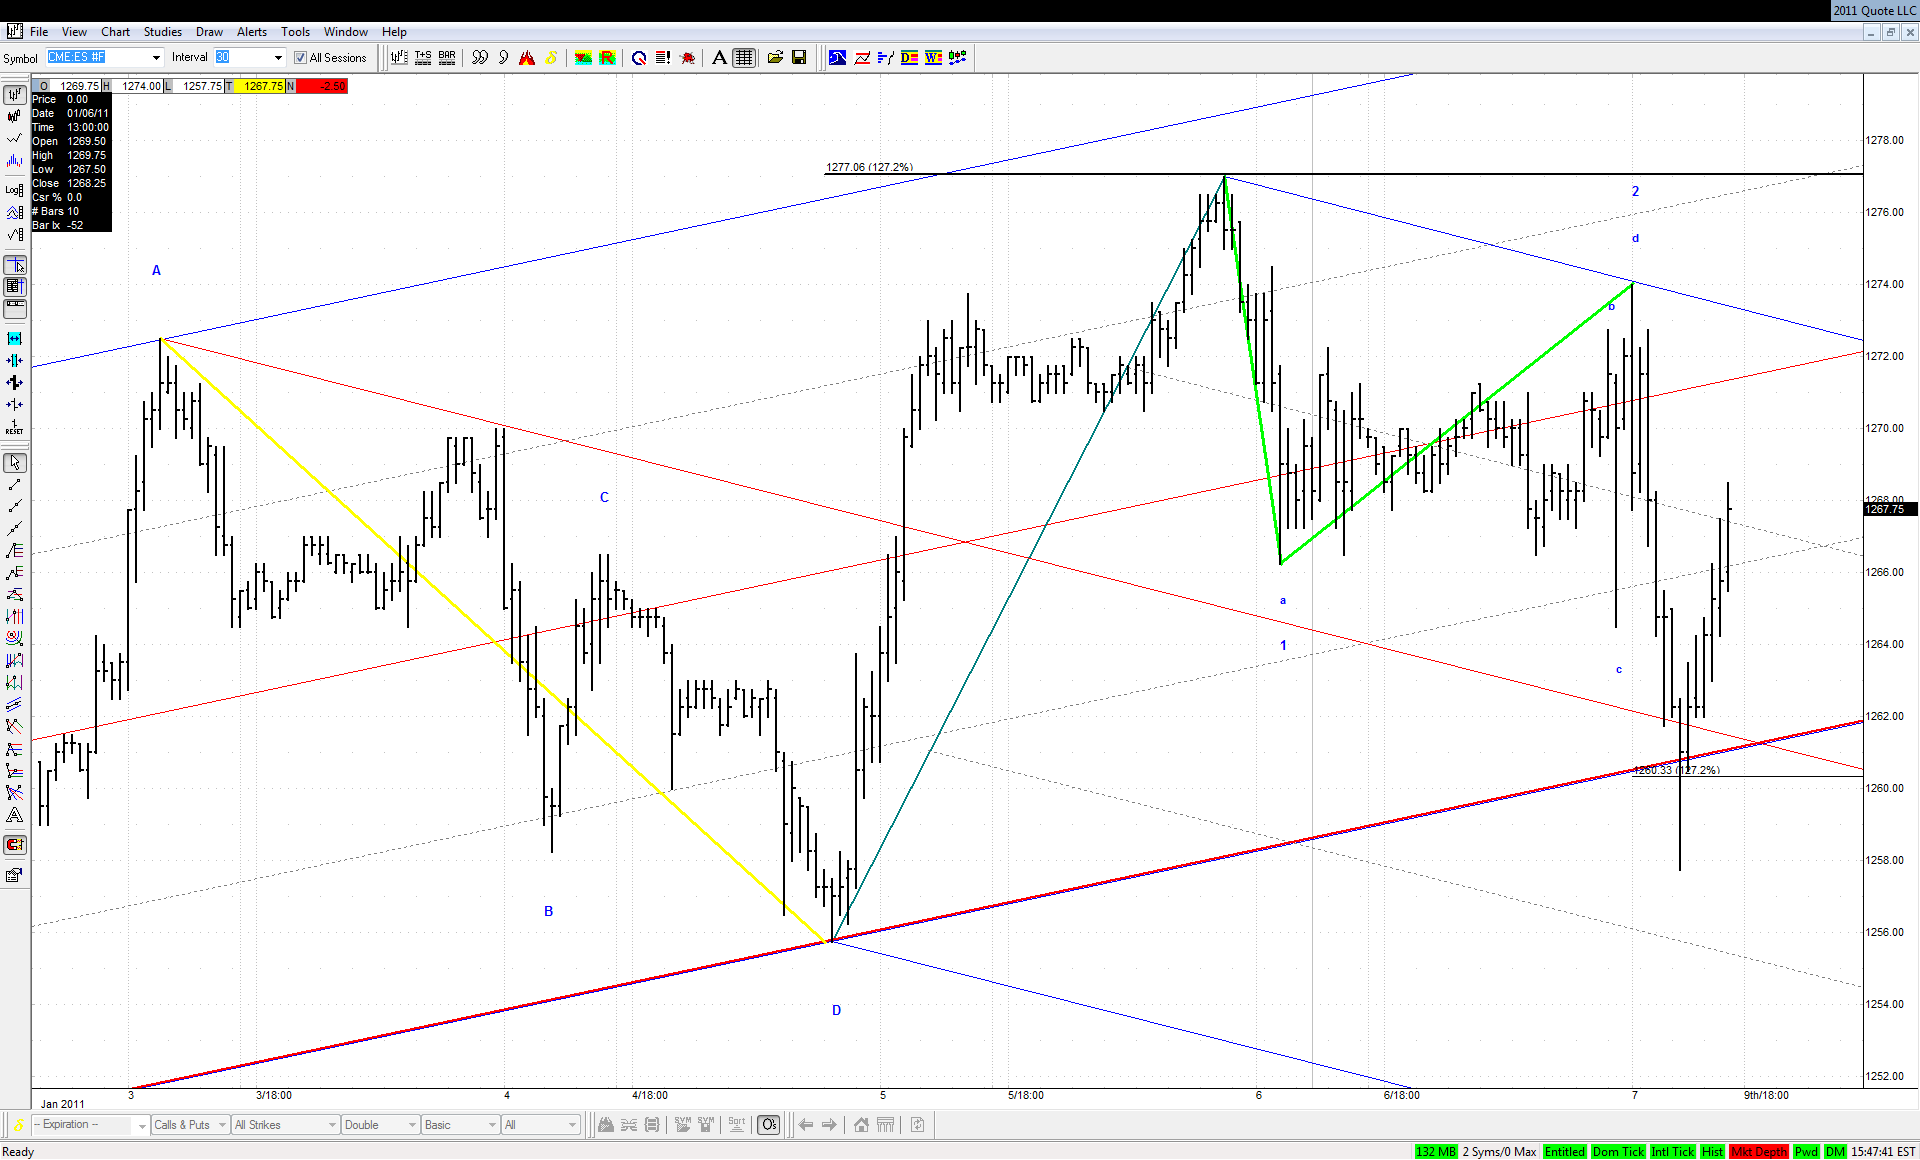
They do this deliberately - respected TL gave way, 1.272 projection was broken to the downside suggesting W3 down and ... they run it straight up for more than 10 points:


Click image for original size
JA
jarek
Rep: 94
Posts: 3,474
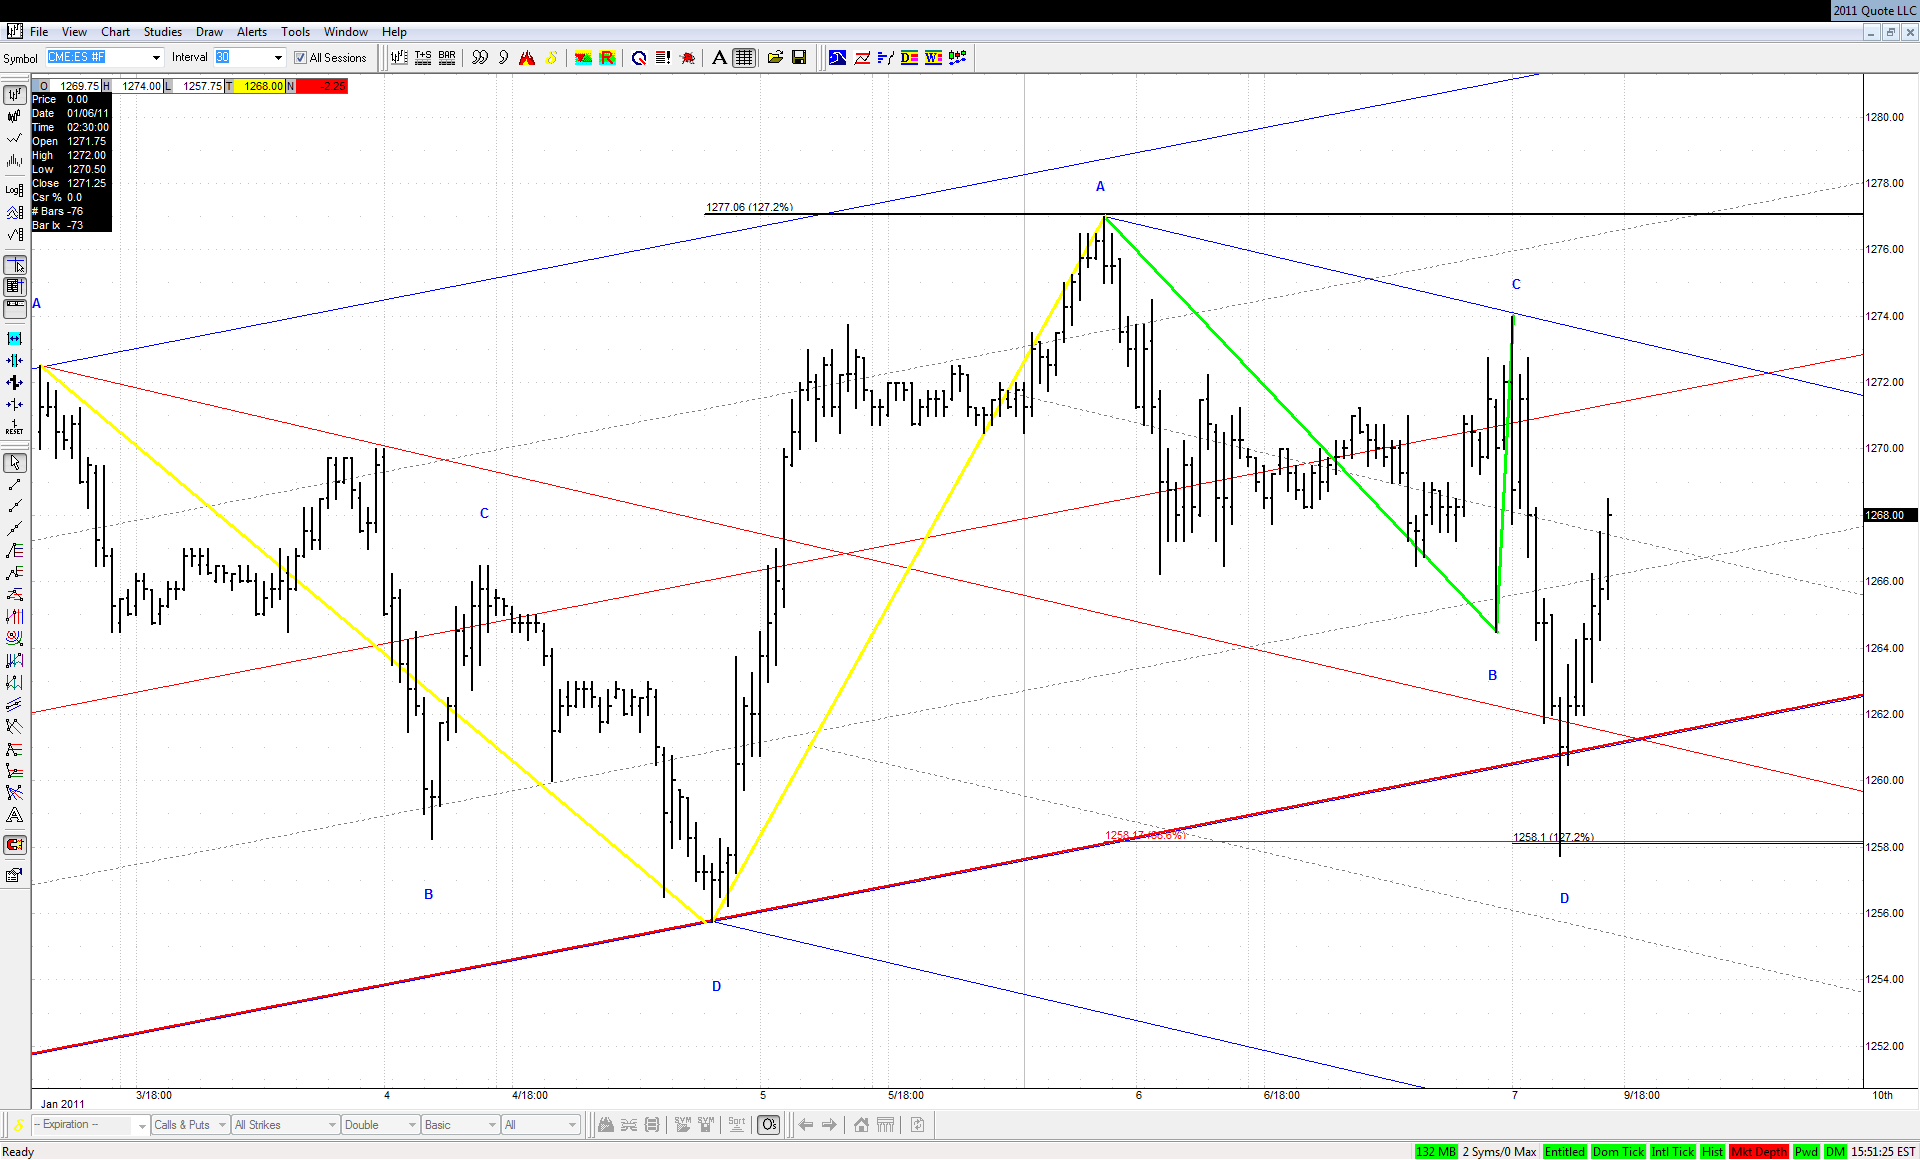
... or maybe I should look at the following disproportionate ABCD:


Click image for original size


But what about the lines?
RO
roofer
Rep: 3,689
Posts: 3,574
j-re cci... i simply did what i always do....collected.....the trader joed is a master of trading the combo of hurst bands and indicators... but i always found his 4 chart system cumbersome... so i created charts with the bands and indicators from multiple time frames on a single chart... then i studied how the indicators setup at hundreds of thousands turn..... i found for myself repeating patterns....i have memorized the best to the point i can take a blank sheet of paper and draw them.so when i see an ideal indicator setup with a powerful geometric setup i have confidence,,, istudied the work of the cci traders and could not integrate their work with mine.so i found what i could integrate.
JA
jarek
Rep: 94
Posts: 3,474
Thanks again - this is very valuable information for me