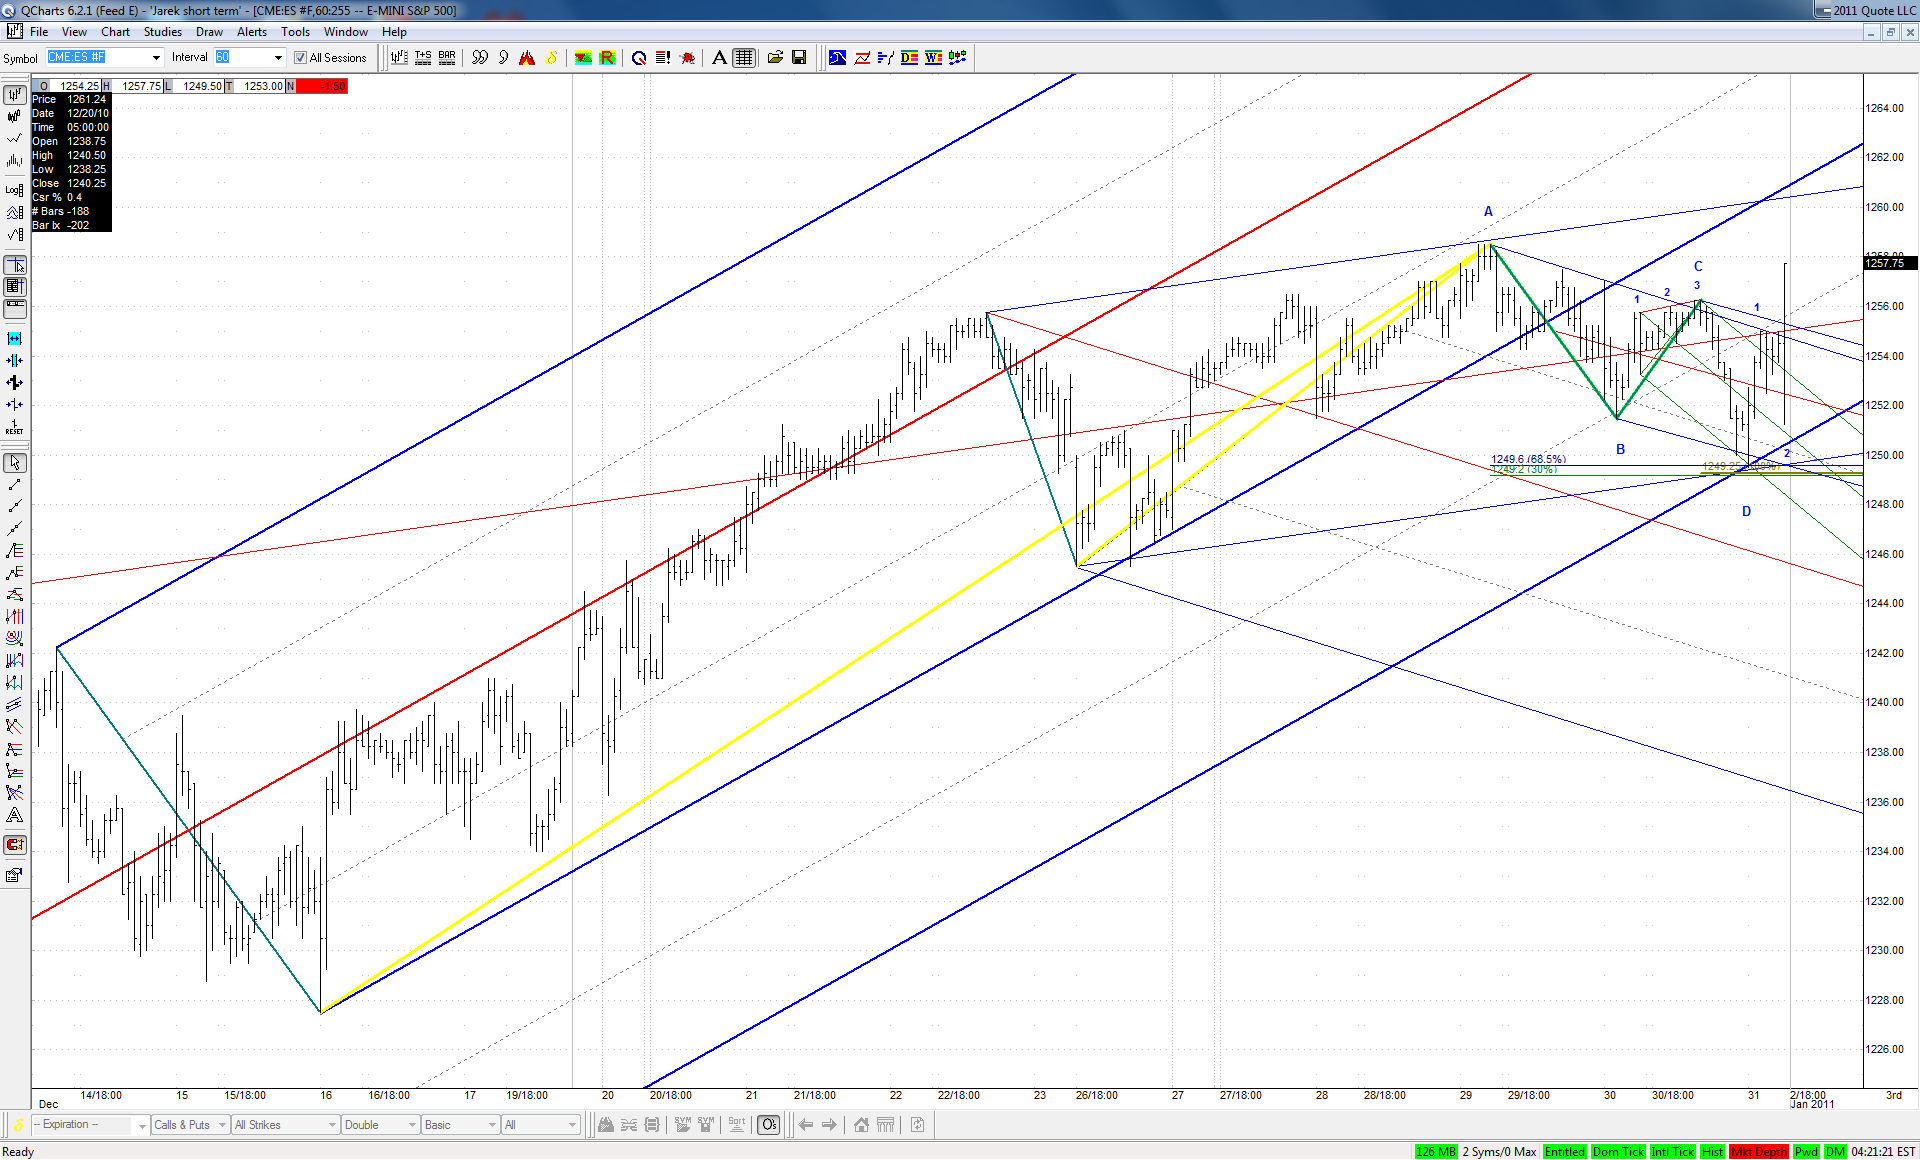
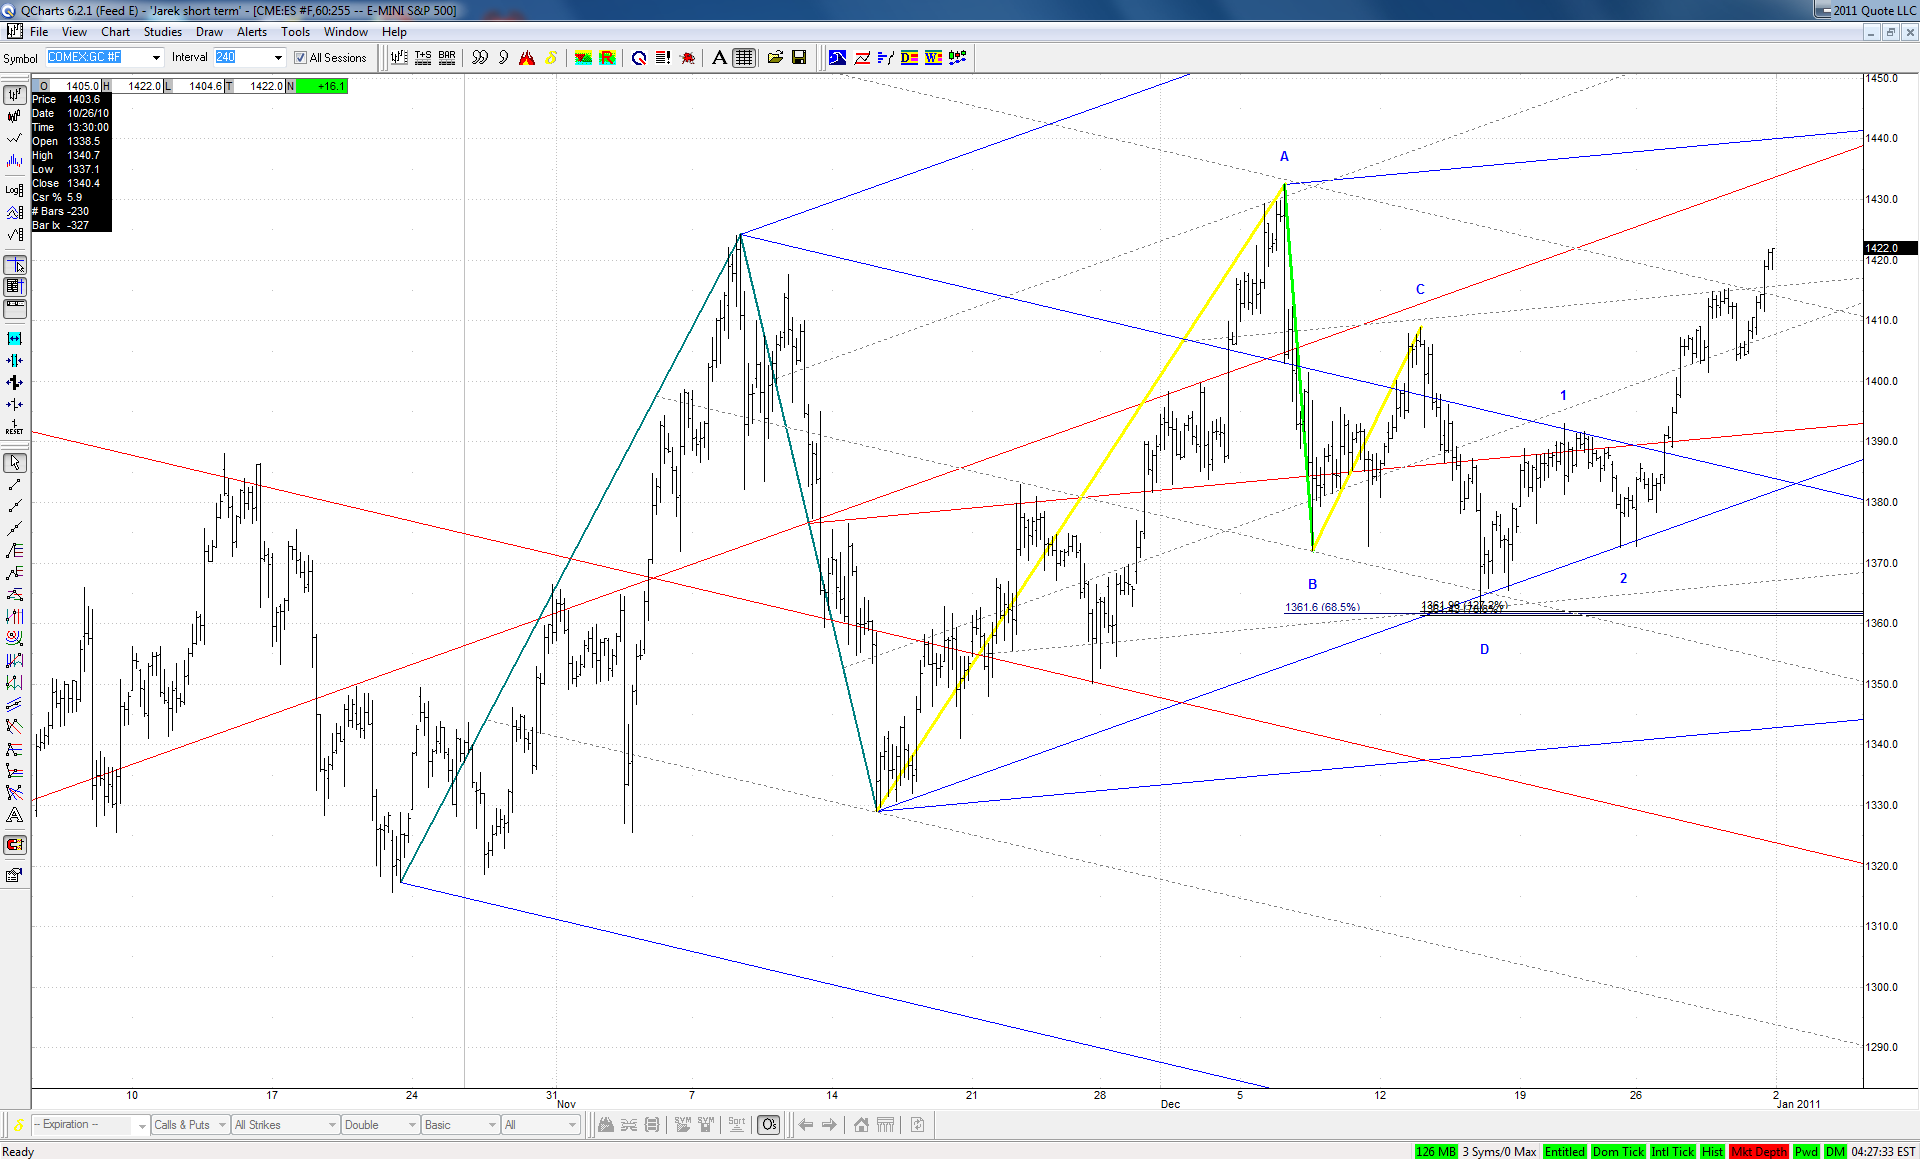
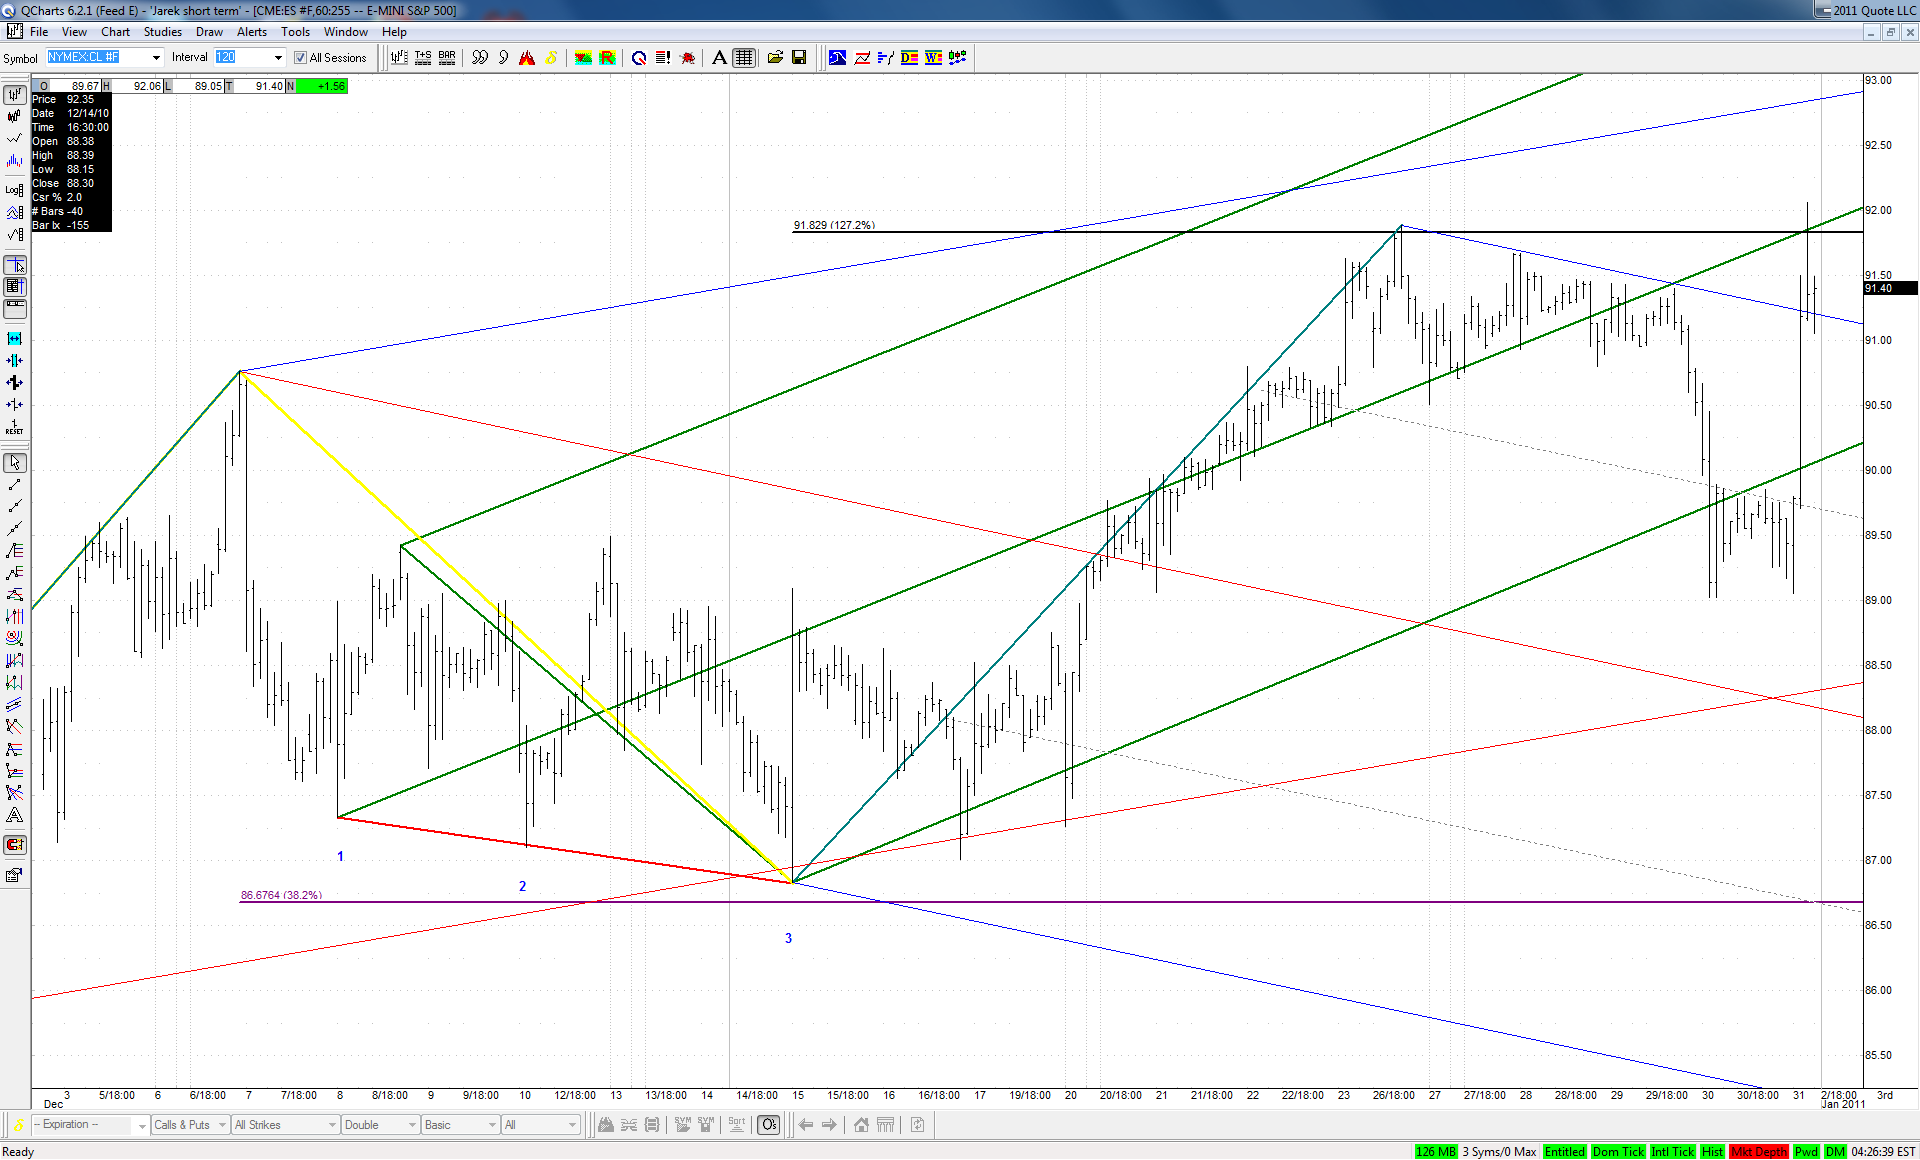
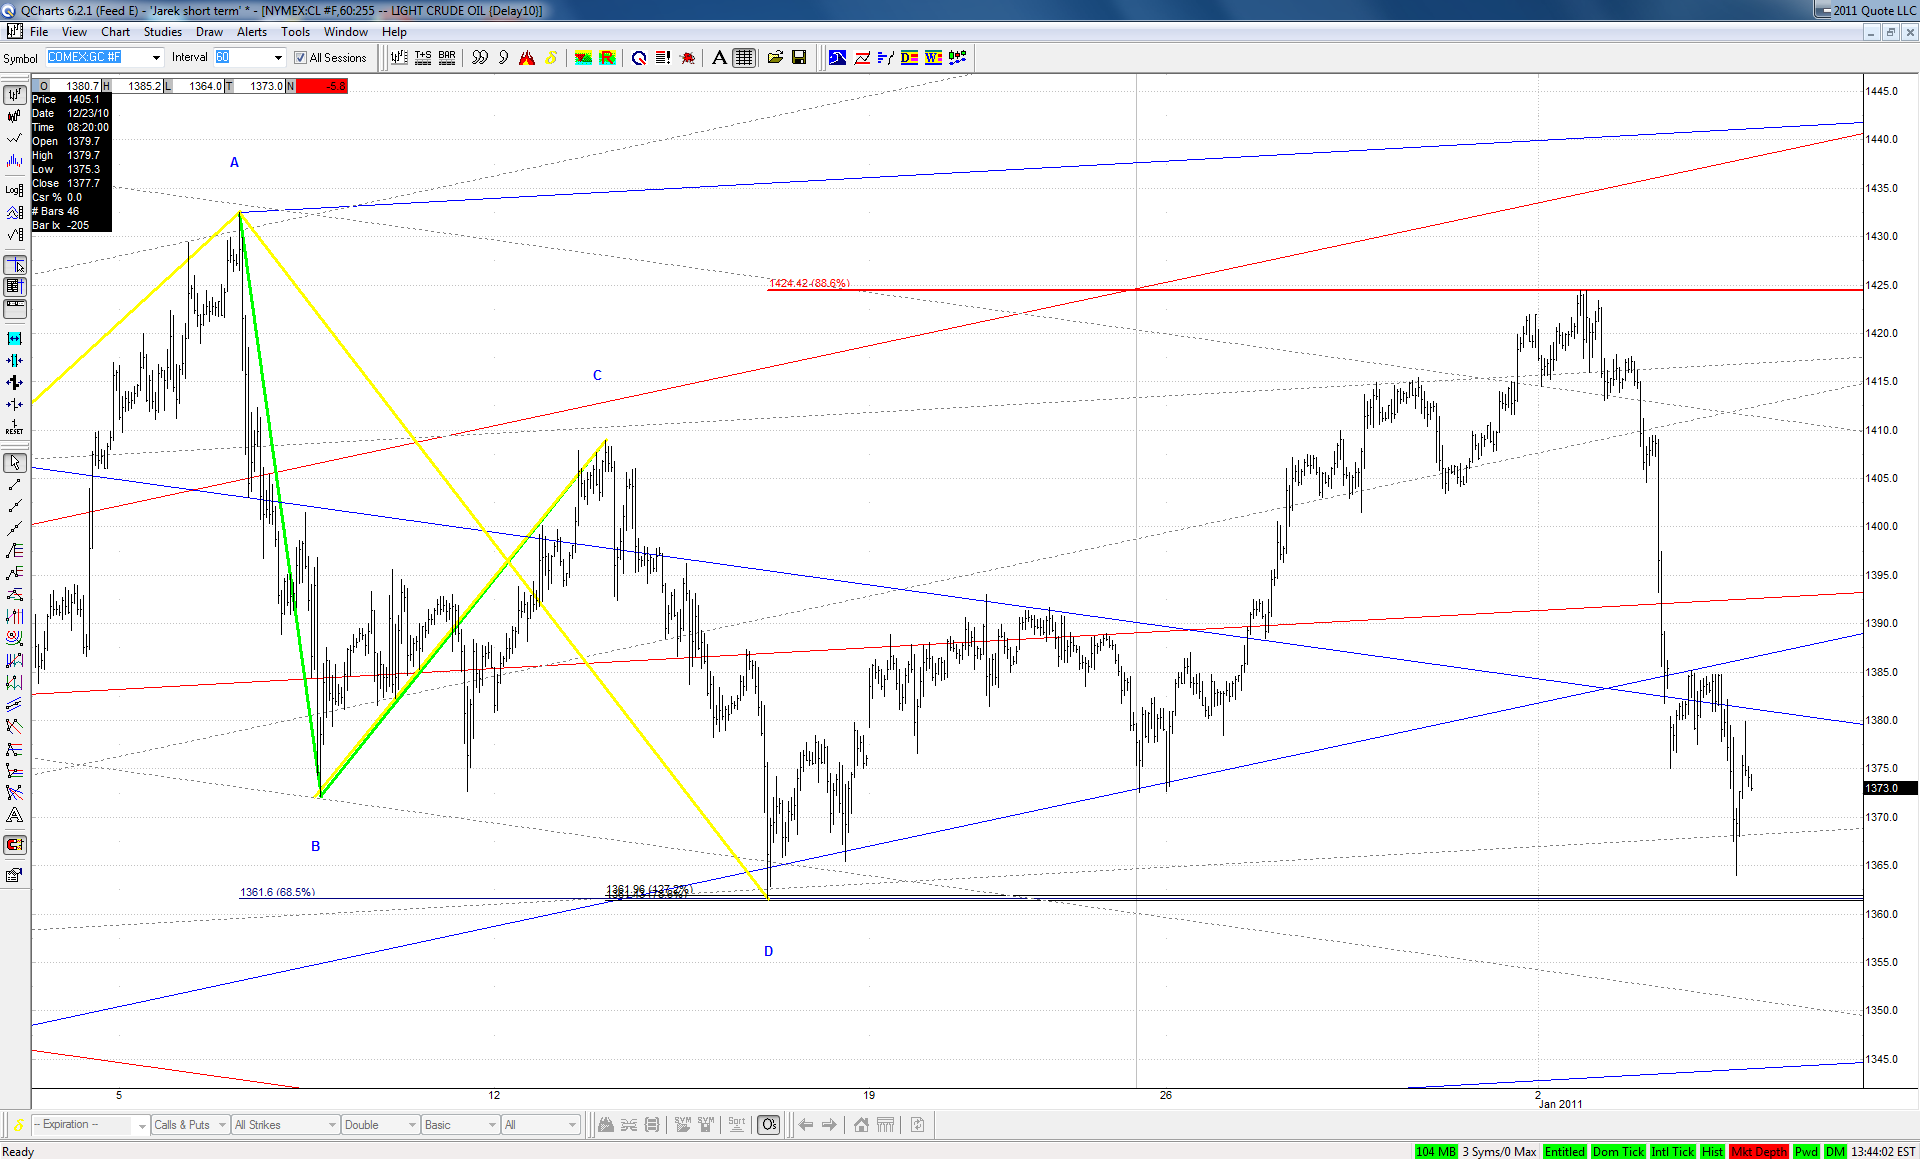
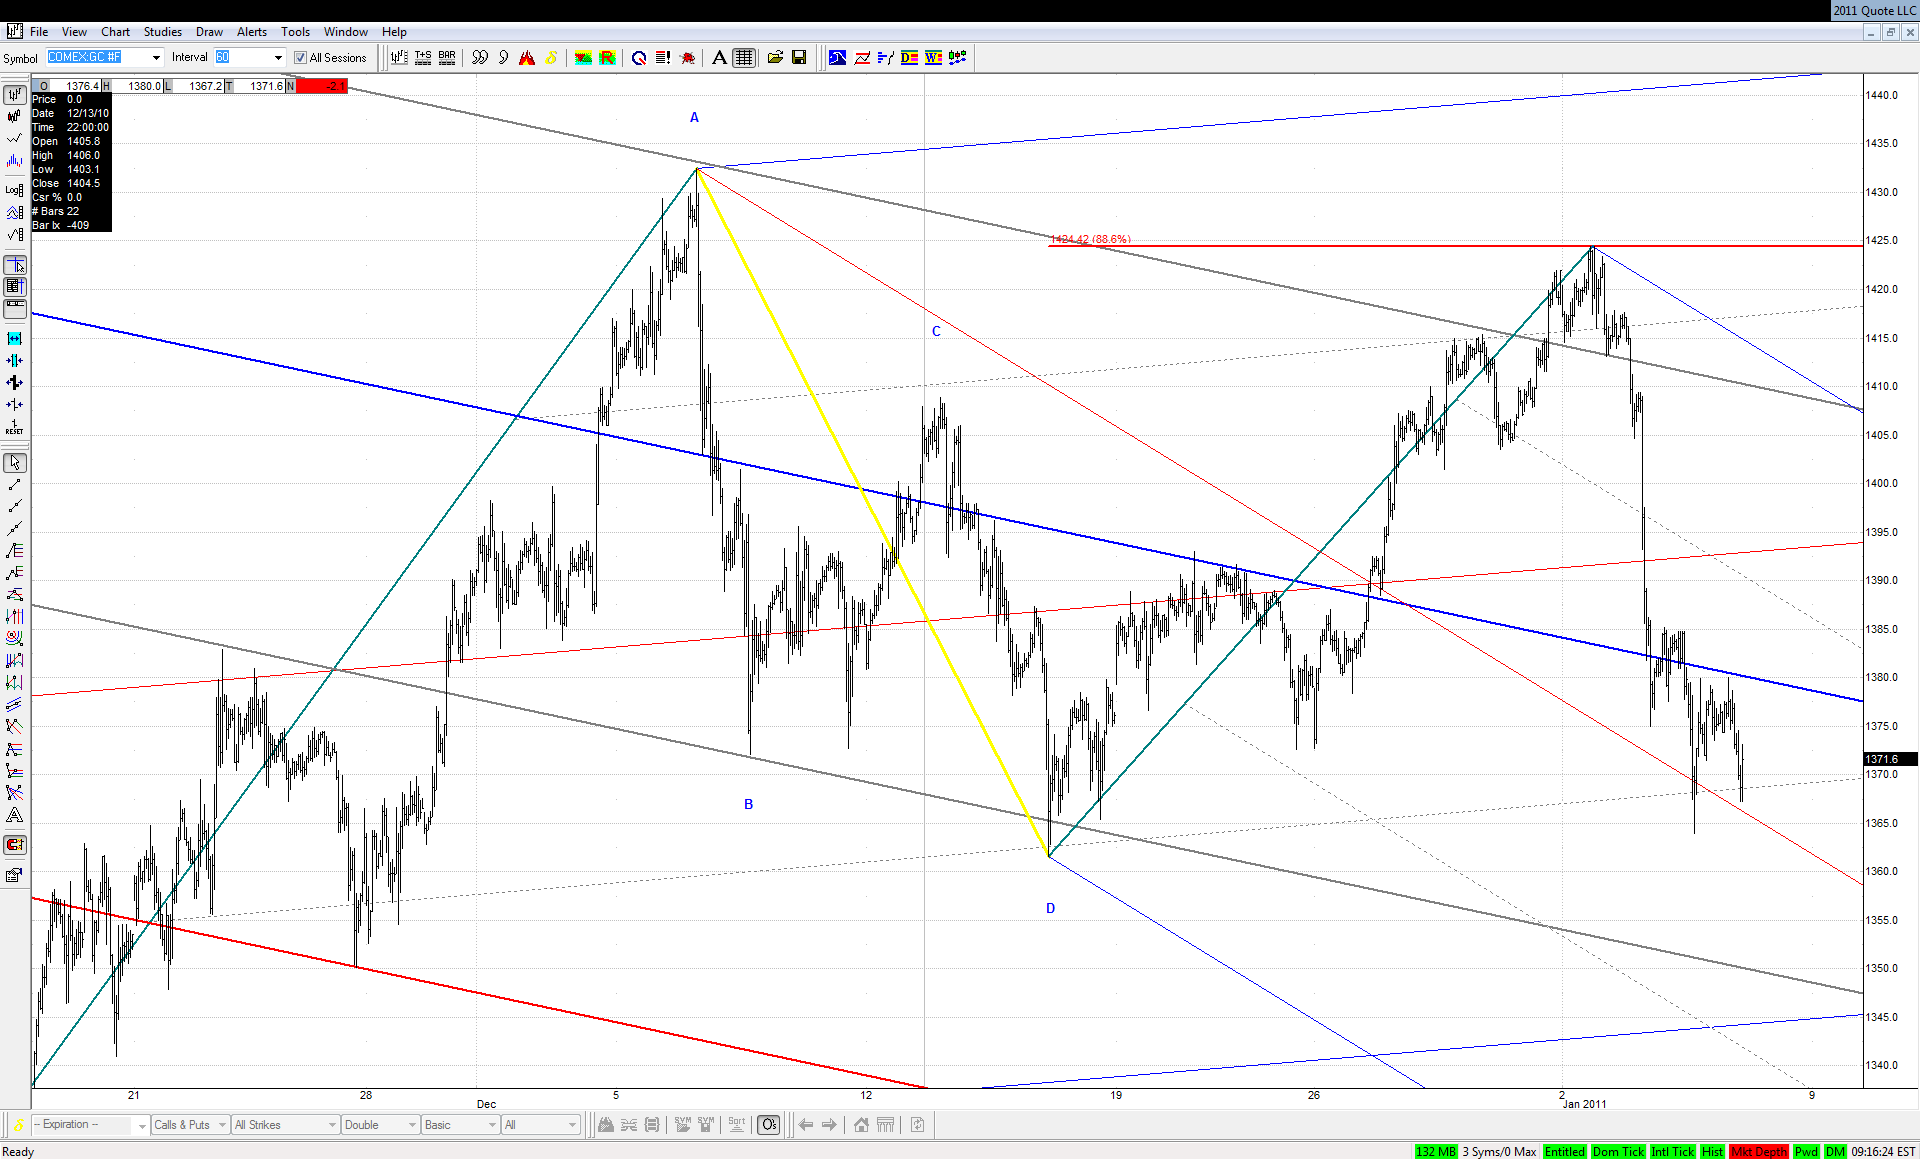
Gold looks pretty weak in today's environment. It might have been THE .886 at recent high:
Click image for original size
JA
jarek
Rep: 94
Posts: 3,474
1
(Edited )
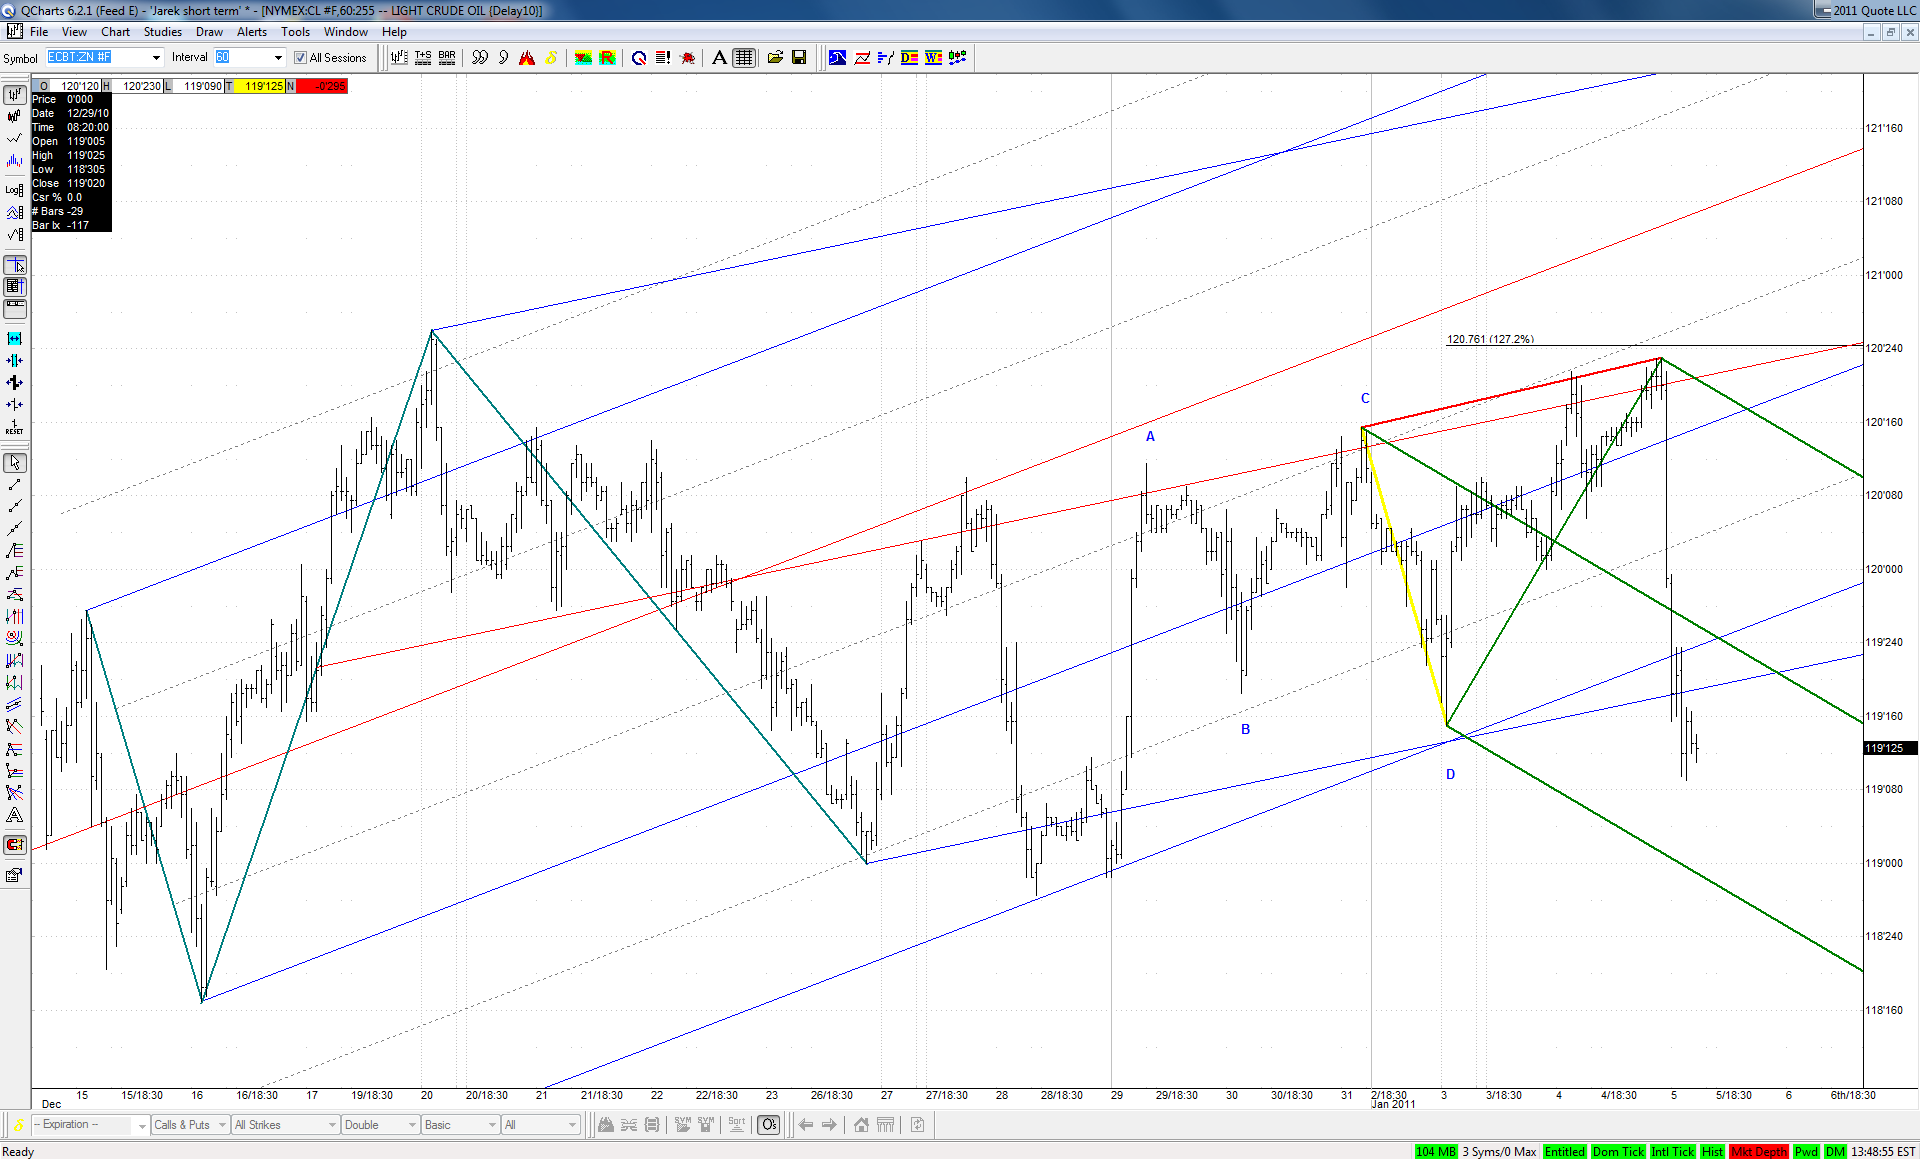
Bullish ABCD in Bonds played out just to 1.272 at a spike line, where the green set quickly took over and did its job:
Click image for original size
JI
jimkane
Rep: 3,058
Posts: 33,089
2
Great charts, guys.
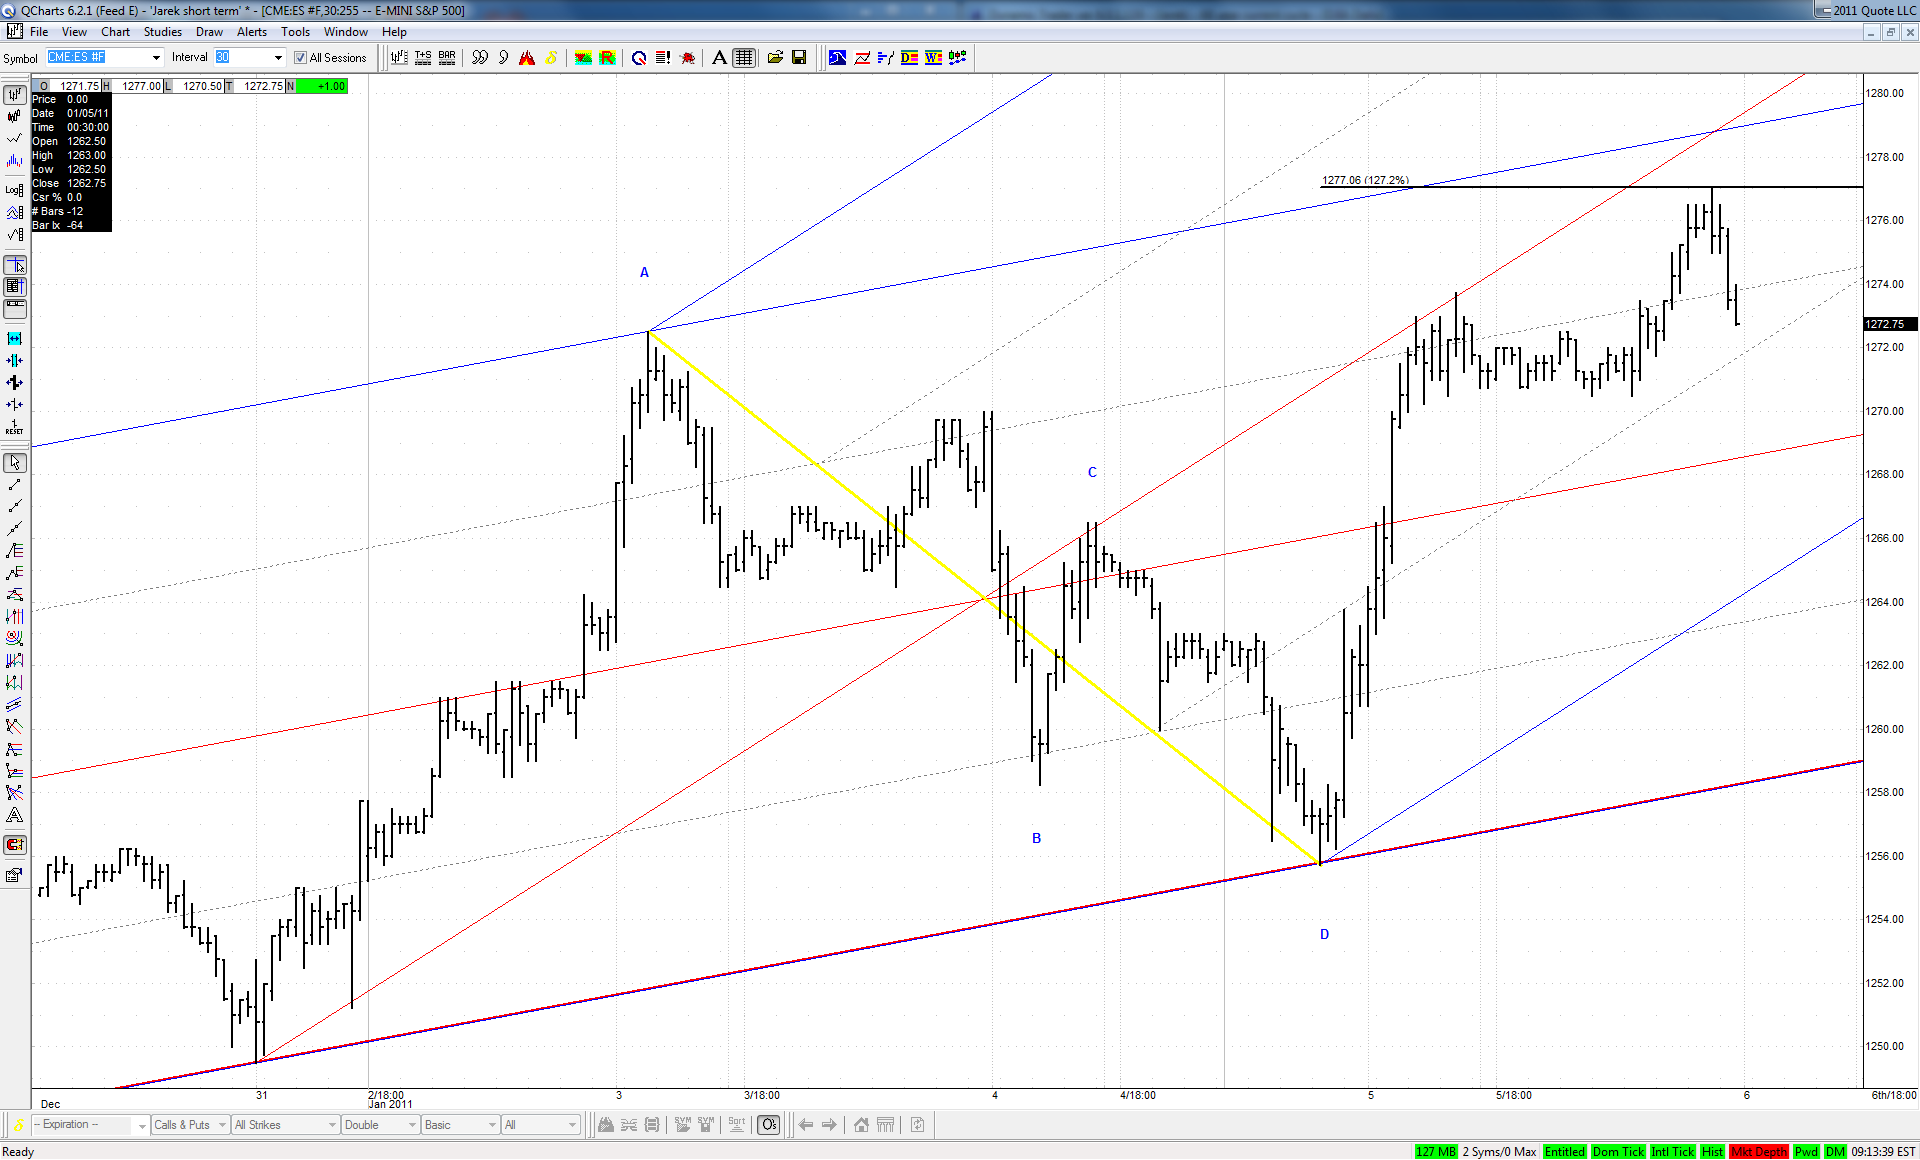
I'd think this would want the 1277 area next. It's no surprise it is doing its 'stop dead at the brick wall and consolidate for the next burst up routine' right at this spot, though. If it were going to 'fail', this would be the spot, in my opinion.
JI
jimkane
Rep: 3,058
Posts: 33,089
0
Notice, too, it's two ticks over the recent 'bulls#%&' market high.
JI
jimkane
Rep: 3,058
Posts: 33,089
1
I'd watch this 70.50 to see if they come in here, for the first clue. Look at the possible ABCD's here, with their nominal variations.
JI
jimkane
Rep: 3,058
Posts: 33,089
0
Here they come, right off 70.50. Let's see if they sustain it, or not. I say new highs very, very soon. These guys are too obvious...
JI
jimkane
Rep: 3,058
Posts: 33,089
0
And there's the new high off the ABCD for the entire 'bulls#%&' market. Sure, sometimes my read isn't dead on. Sometimes...