ES short term trading 01/07/11
Some numbers for today's trading.
1266.25 - 1268.00 -1273.50 - 1277.00 - 1281.00
I'm still looking for 1277.00 as first objective and 1281.00 as second objective.
The above will be void if the ES moves below 1266.25.
Below 1266.25 - 1262.50 - 1258.00.
ES trading 1270.00 @ 03:02
Will see, in due time the market will show us the way.
1266.25 - 1268.00 -1273.50 - 1277.00 - 1281.00
I'm still looking for 1277.00 as first objective and 1281.00 as second objective.
The above will be void if the ES moves below 1266.25.
Below 1266.25 - 1262.50 - 1258.00.
ES trading 1270.00 @ 03:02
Will see, in due time the market will show us the way.
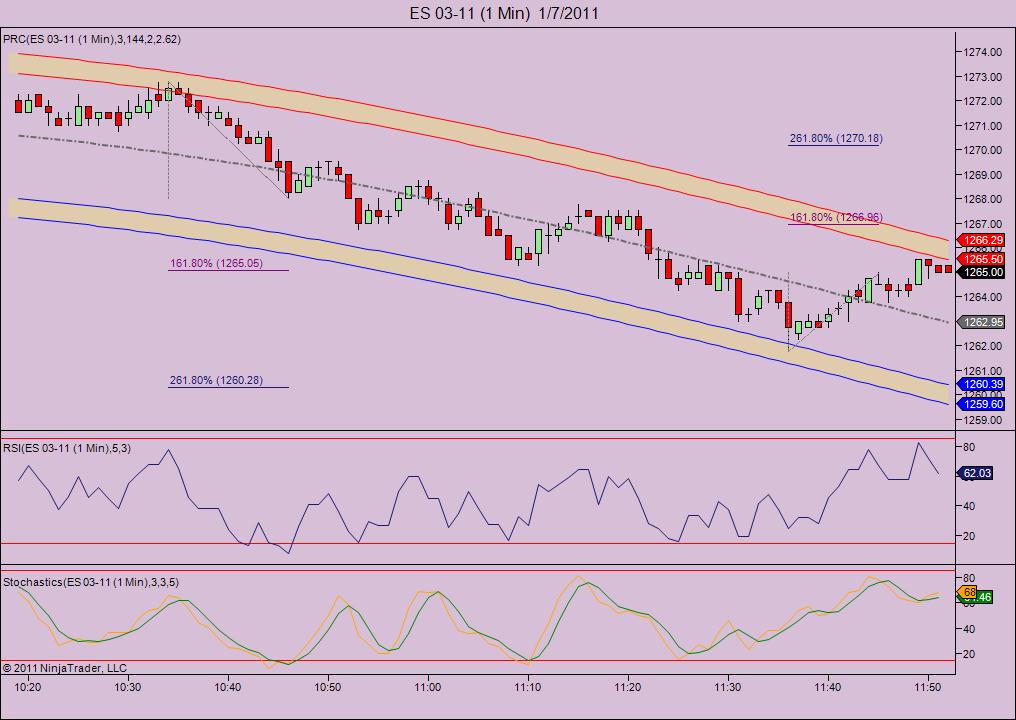
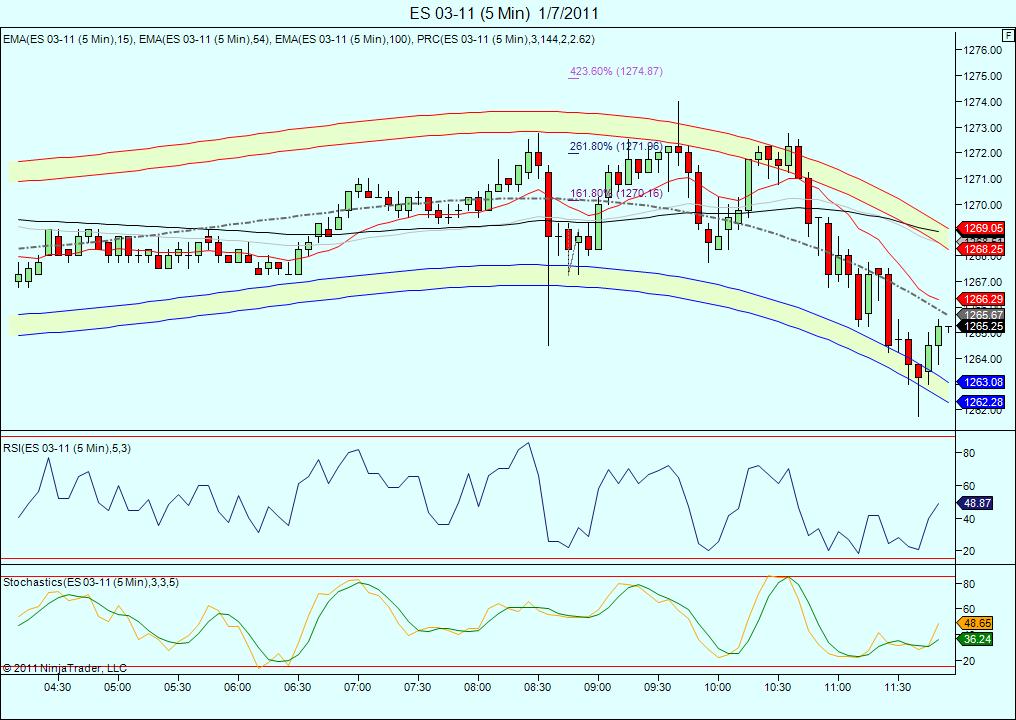
Well the red avg on the 5 min chart is at around 66.50and trending down.. i think i should have held ,but piercing 63 got me very nervous. ONE min chart shows around 67 as long as the current low holds
Click image for original size
Heres a little longer 5 min chart...
Click image for original size
Great call by the way..as you can see im a good analyst, but not such a great trader!.. too skittish! lol
credit is all yours Kool!, i have traded 1000% better since you taught me how to count and do the math. I'm still a little shaky on the counting part though. i would like some help in that area when you have some time.
Sure.. but im going to get some sleep now but the 13 min chart shows the median line on the prc bands at 1267.50 and its red avg (15 period ema is around there too, so combined with the one min projection 1267 looks doable ... if the current low is not touched again, of course!.. Great job Optimus!.. carry on!
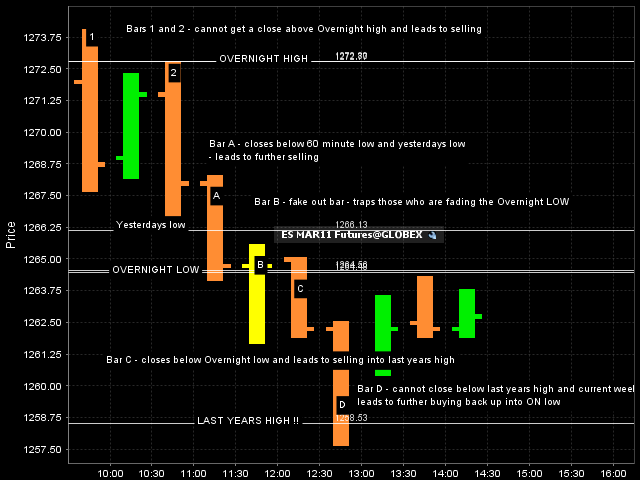
Here are some ideas from the current 30 minute chart. I only took one short today so I am not implying I took these or would have taken any of these specifically. What I do like about the concept is that it deals with areas that the majority of traders can see on the screen like:
Overnight highs and lows, 60 minute highs and lows and Real time highs and lows. Hope it sparks some ideas in a few of you.
I think the biggest conflict from this concept and this chart are the closes of bar A and bar B...that generates opposite signals if one was looking at this as a mechanical method. That is a mistake to use this like that IMHO !
Click image for original size
Bruce,
Have you investigated a strategy as simple as a trade in the direction of a 30 min close above/below the prior 30 min H/L?
Have you investigated a strategy as simple as a trade in the direction of a 30 min close above/below the prior 30 min H/L?
Originally posted by BruceM
Here are some ideas from the current 30 minute chart. I only took one short today so I am not implying I took these or would have taken any of these specifically. What I do like about the concept is that it deals with areas that the majority of traders can see on the screen like:
Overnight highs and lows, 60 minute highs and lows and Real time highs and lows. Hope it sparks some ideas in a few of you.
I think the biggest conflict from this concept and this chart are the closes of bar A and bar B...that generates opposite signals if one was looking at this as a mechanical method. That is a mistake to use this like that IMHO !
Click image for original size
No I haven't lorn but will take a look.....mostly I like this as a basic filter for mean reversion and to find a way to hold final runners longer...
I was once told that the big players will look not only at where we close on the daily time frame but also the 30 and 60 minute closes...not sure if it's true.....this concept also can be compared to some of the concepts of the 80% market profile rule which is not a rule that really works...just one of those things that gets passed along the internet
I was once told that the big players will look not only at where we close on the daily time frame but also the 30 and 60 minute closes...not sure if it's true.....this concept also can be compared to some of the concepts of the 80% market profile rule which is not a rule that really works...just one of those things that gets passed along the internet
Emini Day Trading /
Daily Notes /
Forecast /
Economic Events /
Search /
Terms and Conditions /
Disclaimer /
Books /
Online Books /
Site Map /
Contact /
Privacy Policy /
Links /
About /
Day Trading Forum /
Investment Calculators /
Pivot Point Calculator /
Market Profile Generator /
Fibonacci Calculator /
Mailing List /
Advertise Here /
Articles /
Financial Terms /
Brokers /
Software /
Holidays /
Stock Split Calendar /
Mortgage Calculator /
Donate
Copyright © 2004-2023, MyPivots. All rights reserved.
Copyright © 2004-2023, MyPivots. All rights reserved.