ES Short Term Trading 01-27-2011
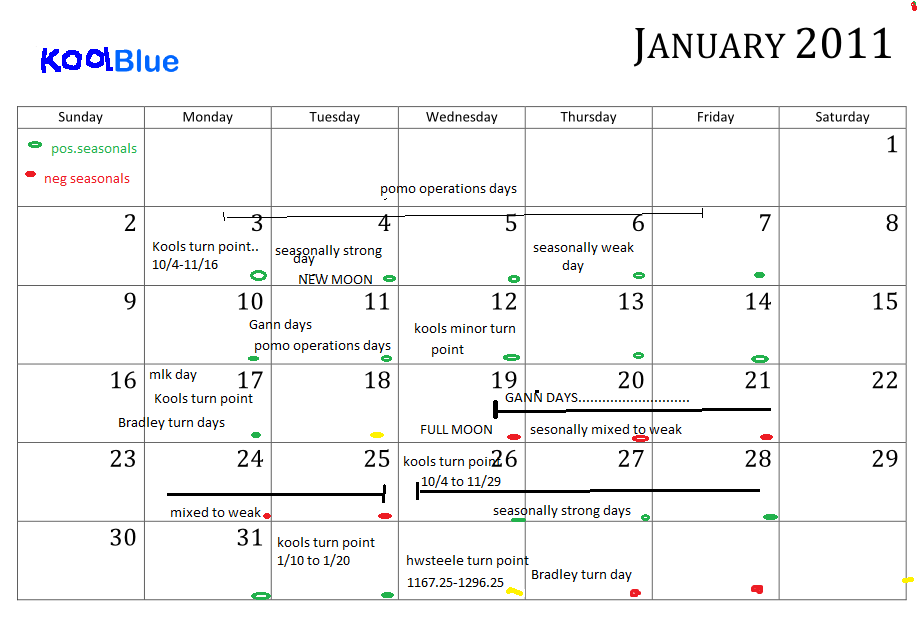
Good morning: well, as predicted, the bullish (and historical) positive nature of these days (till tues, or wed next week) resulted in new rally highs and a new rally close on the cash index. Note that the nas(once again) advanced a higher % than the s&p cash, which i interpet as short term bullish. So far my opinion advanced over the last several weekend previews has played out well! I believe, in a nutshell ,we will continue to edge higher till next tues -wed and a major decline has the potential to begin.First observe the calendar...
Click image for original size
Price wise i have a daily targets at 1302.50,1305.5 and 1312.(for example)
Click image for original size
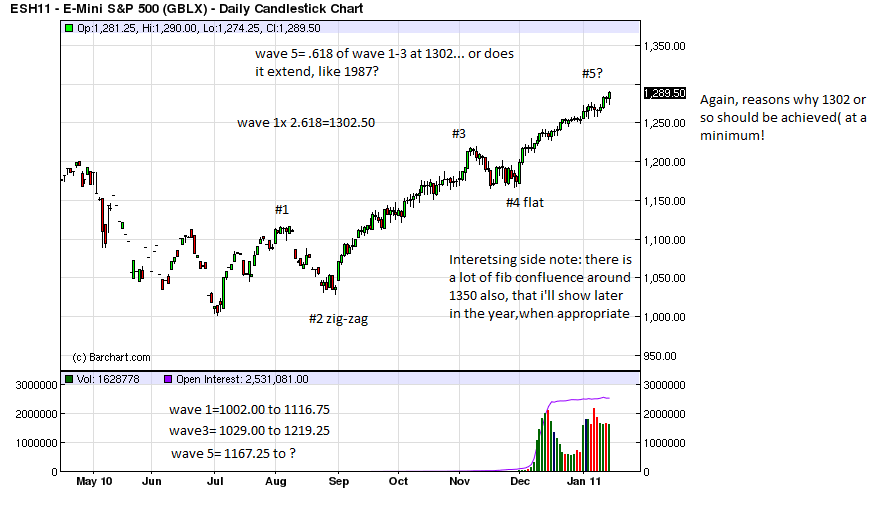
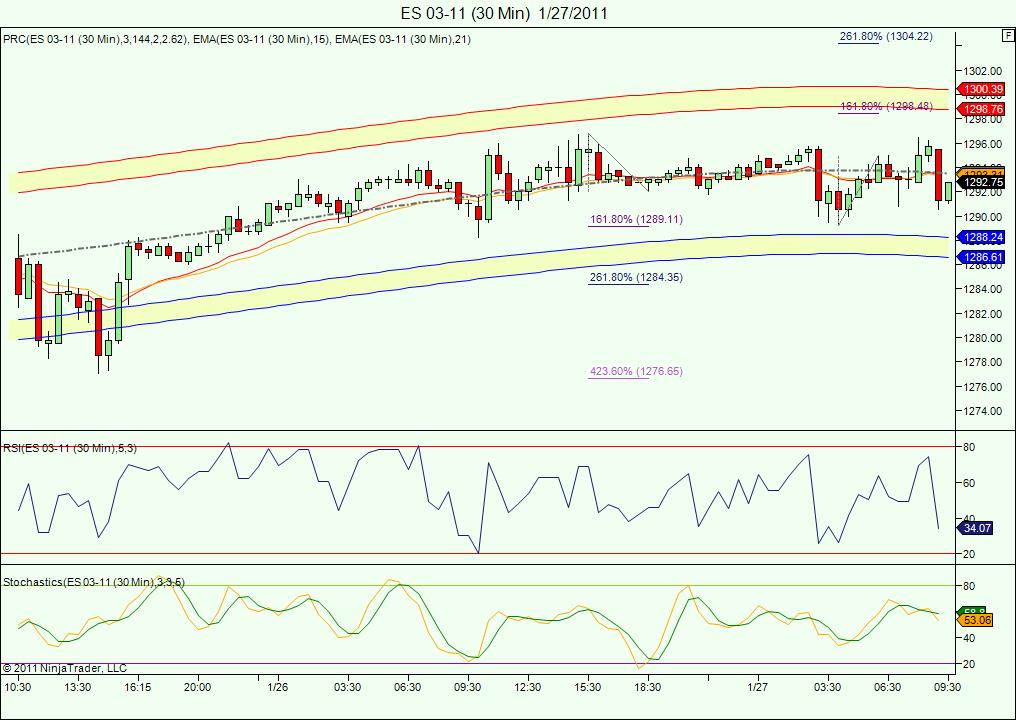
.. and from Frank Hogelucht some historical evidence..."After posting a fresh 52-week high on an FOMC announcement session in the past, the market was regularly trading higher four and five sessions later (72.73% and 79.55% of the time respectively, significantly better then the at-any-time chances for a higher close four and five sessions later),".. of course tues is day 4 and wed day 5. For these reasons , i prefer longs ,but will scalp both ways,of course! (hey Monkey! any move above 1300 the next few days you might want to consider puts!).. The bigger picture heading into the rth...Click image for original size
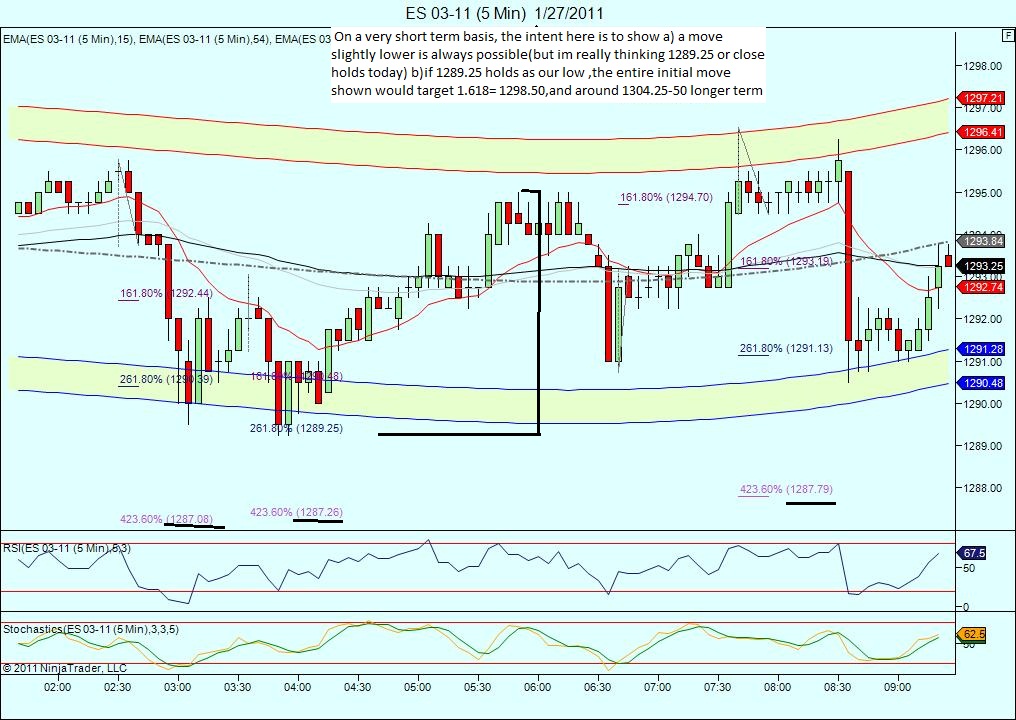
A little shorter term view early...
Click image for original size
.. i wont be posting as much today as a) i think i post too much and tend to dominate the thread b) ive been very profitable lately, so i need a rest! and c) i got a sore throat and feel like crap!
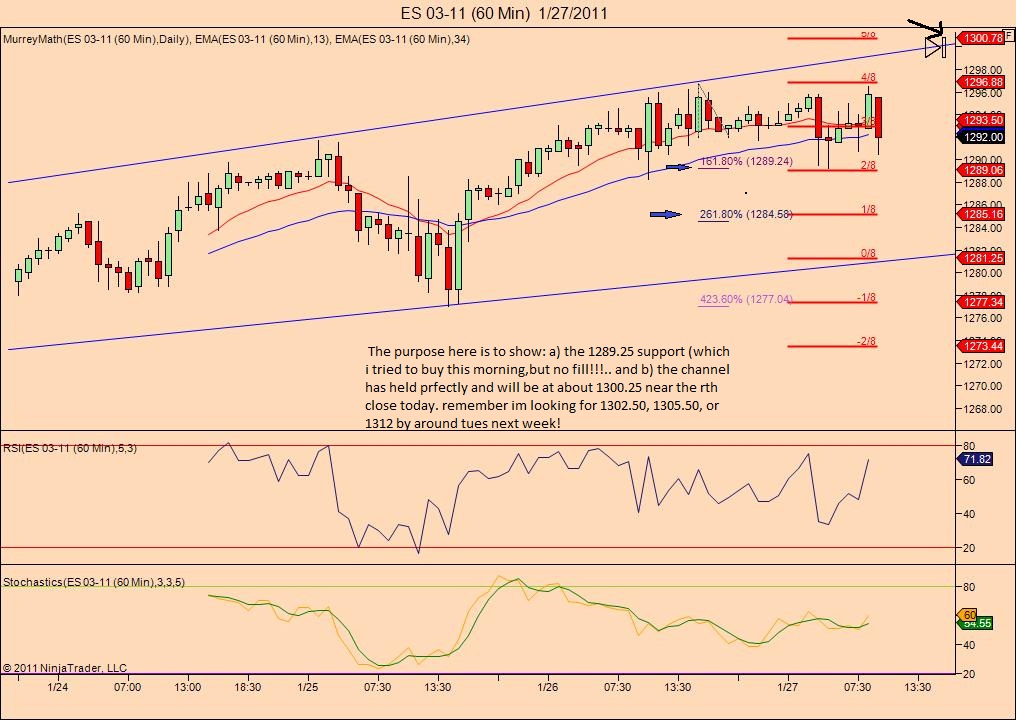
here's my chart today.. as you can see we skimmed across the top yesterday and i would expect a similar day today should the market push upwards. i showed a fib ext..if you look at the 89 level.. there's a median line there that seems to be S/R but works more like a check point for price and usually a good indicator how strong a move is. if we break it.. i would expect to see more downward pressure towards the 85 level. i will buy the dips today.
Click image for original size
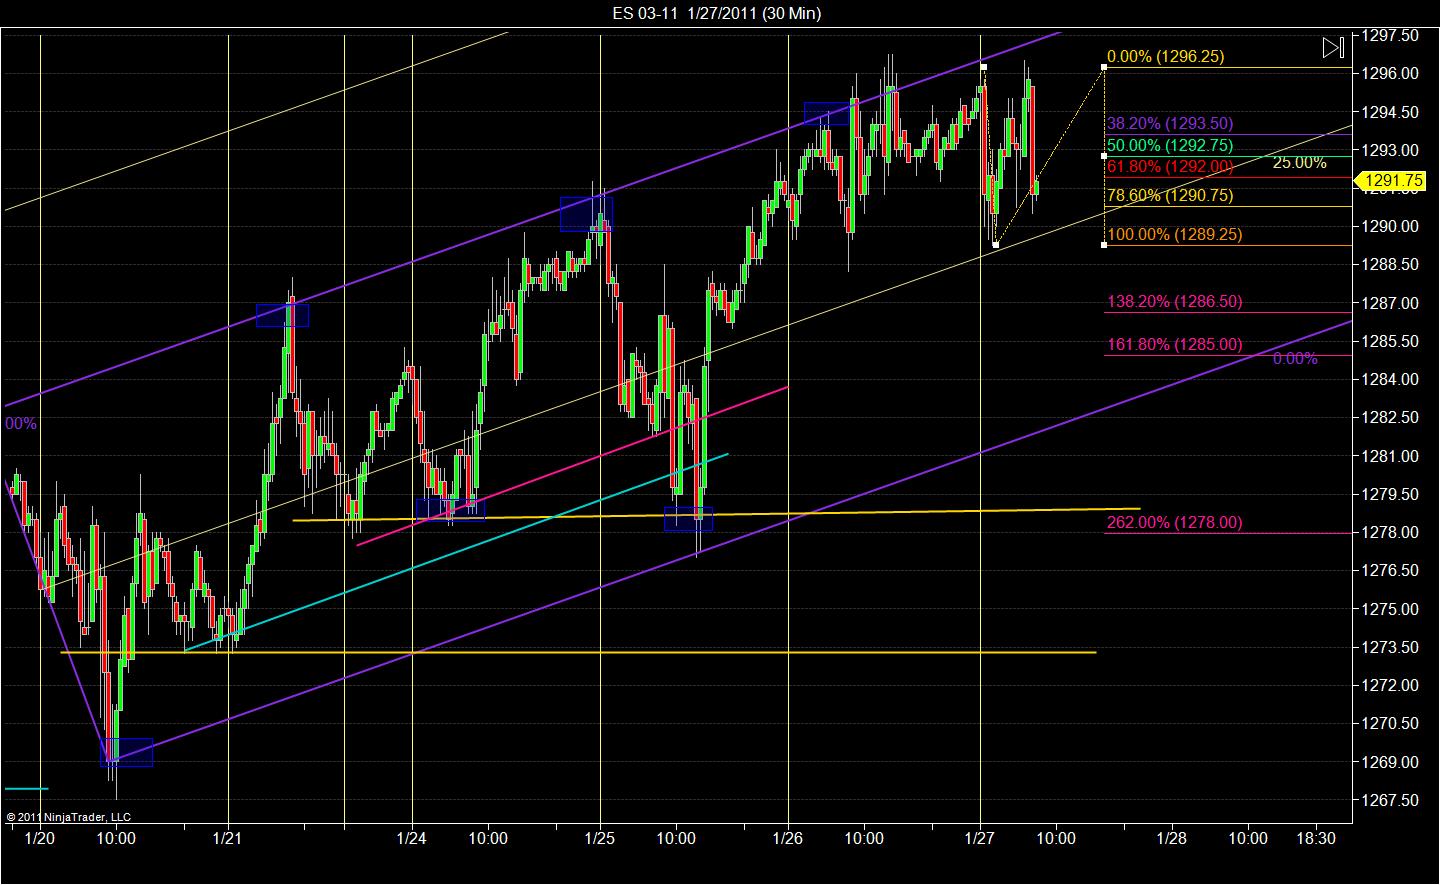
sorry, here's the chart
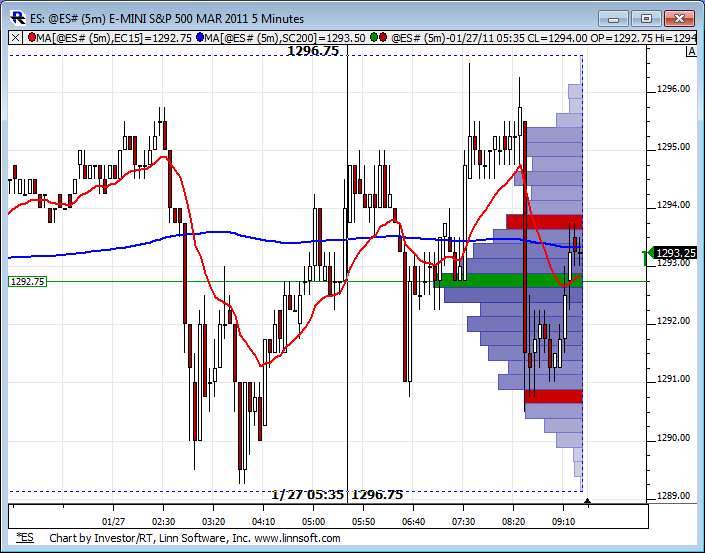
ON Profile.
Click image for original size
Click image for original size
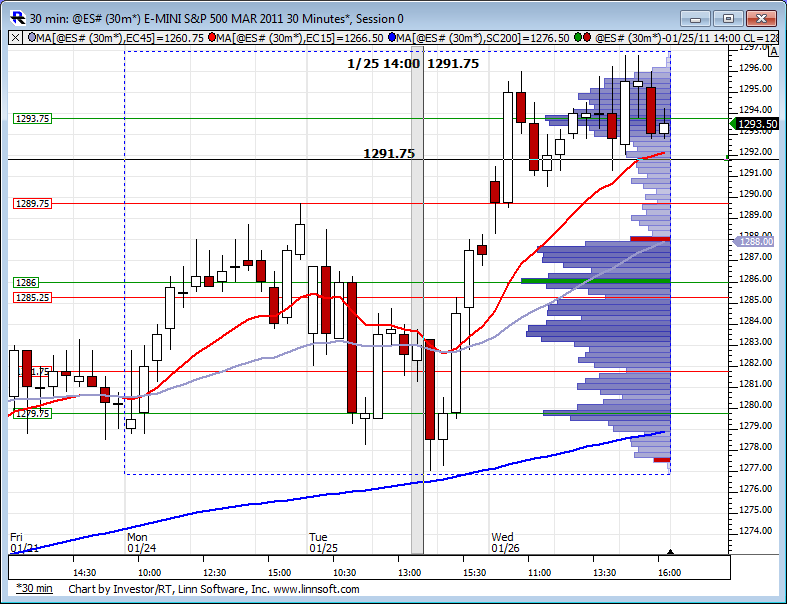
..currently short the 1293.75 proj and median line on the 5 min chart, as i expect a retest of 1289 in the rth!... Good trading all!!!
we will probably bounce around in a narrow range until the new home sales report in about 12 minutes
TICK is in a pathetic range here...like OP says, waiting till 10:00 report.
1291.25 looms as a very good long opp. and prc buy on both the 5 and 13 min charts here.
I just wanted to express my appreciation for this forum! The information sharing is wonderful and I also appreciate the level at which the discourse is kept. Wow that sounded fancy! LOL!
It is a pleasure that we can have differing views and remain civil about it, a far cry from many other forums. Trading forums and others.
Thanks to all and best of fortune (not luck) trading!!
It is a pleasure that we can have differing views and remain civil about it, a far cry from many other forums. Trading forums and others.
Thanks to all and best of fortune (not luck) trading!!
Emini Day Trading /
Daily Notes /
Forecast /
Economic Events /
Search /
Terms and Conditions /
Disclaimer /
Books /
Online Books /
Site Map /
Contact /
Privacy Policy /
Links /
About /
Day Trading Forum /
Investment Calculators /
Pivot Point Calculator /
Market Profile Generator /
Fibonacci Calculator /
Mailing List /
Advertise Here /
Articles /
Financial Terms /
Brokers /
Software /
Holidays /
Stock Split Calendar /
Mortgage Calculator /
Donate
Copyright © 2004-2023, MyPivots. All rights reserved.
Copyright © 2004-2023, MyPivots. All rights reserved.