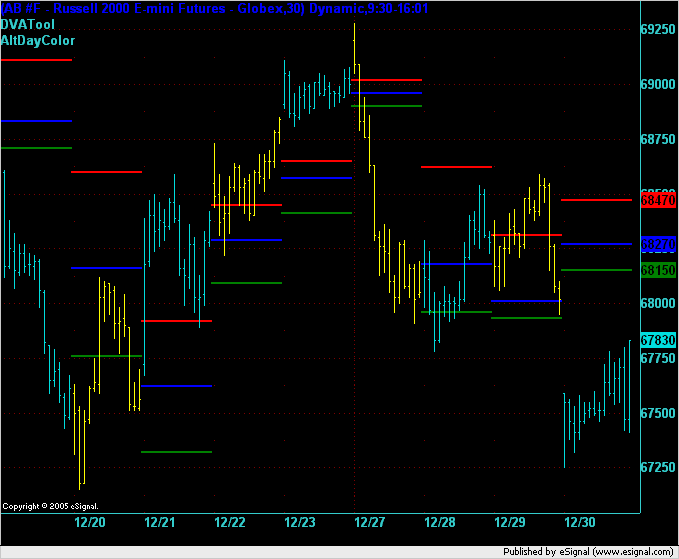
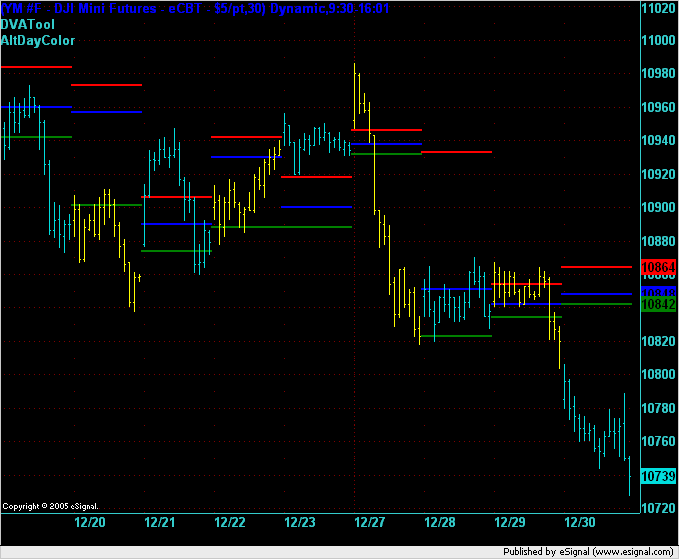
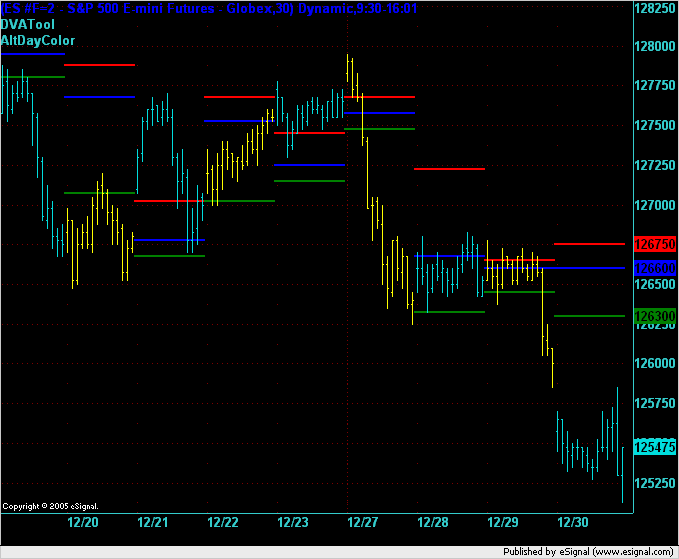
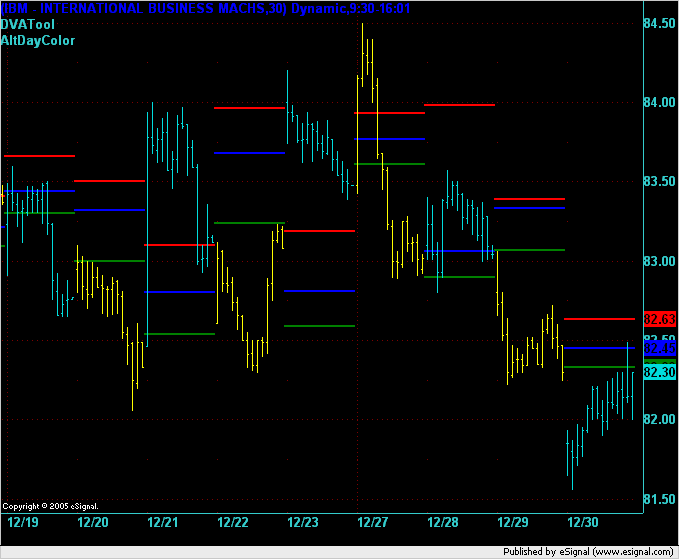
Market Profile over the last 2 weeks
Here are some Market Profile charts from the last 2 weeks in 4 different markets: ER2, YM, ES, and IBM. The bars on each day are painted a different color to allow you to easily distinguish each day and the 3 lines on each day are the Market Profile Value Area High (VAH), Point of Control (POC), Value Area Low (VAL). The point of these charts is to encourage discussion about how the market reacted to these Market Profile levels and create working strategies for intraday trading of these markets using Market Profile. Comments encouraged....
Emini Day Trading /
Daily Notes /
Forecast /
Economic Events /
Search /
Terms and Conditions /
Disclaimer /
Books /
Online Books /
Site Map /
Contact /
Privacy Policy /
Links /
About /
Day Trading Forum /
Investment Calculators /
Pivot Point Calculator /
Market Profile Generator /
Fibonacci Calculator /
Mailing List /
Advertise Here /
Articles /
Financial Terms /
Brokers /
Software /
Holidays /
Stock Split Calendar /
Mortgage Calculator /
Donate
Copyright © 2004-2023, MyPivots. All rights reserved.
Copyright © 2004-2023, MyPivots. All rights reserved.