ES weekend preview 3-5-11
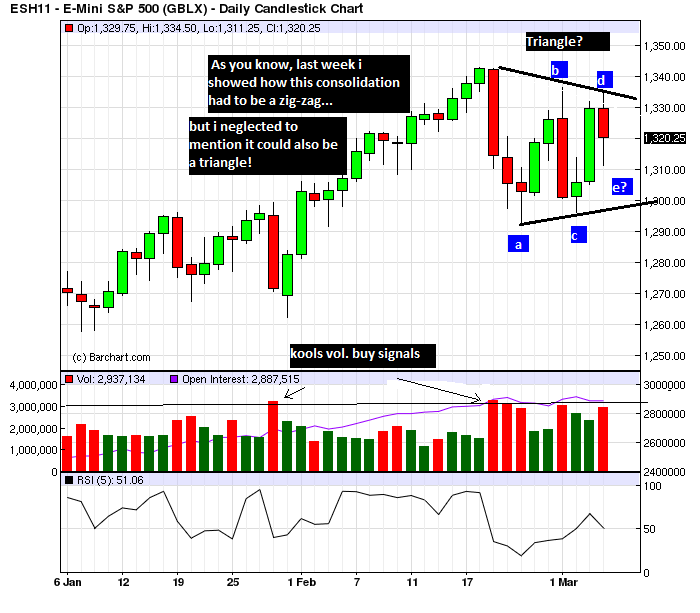
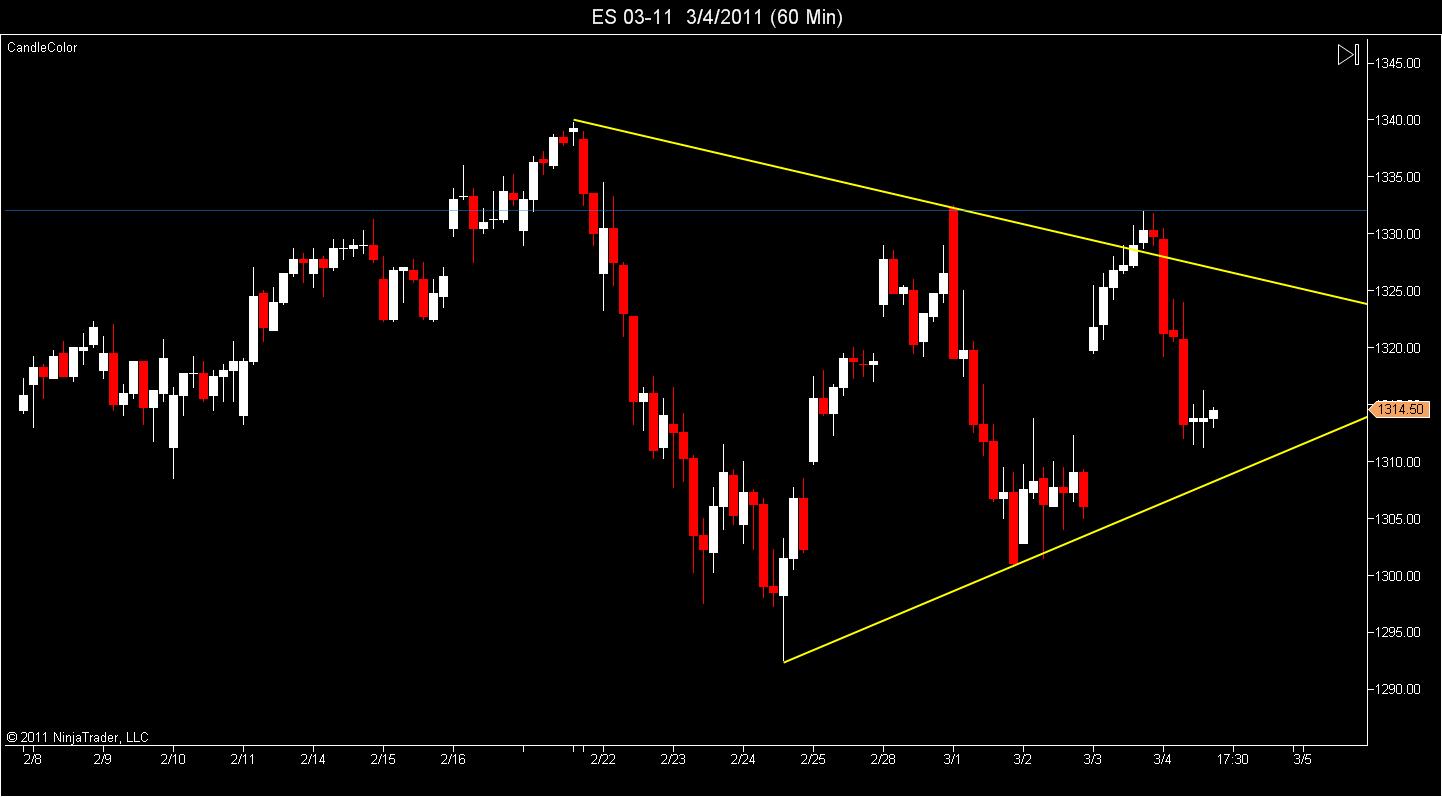
An exiting week is coming up. Some time ago i showed how the market MUST exceed 1257.25 before any big correction. I still believe that to be the case. I also showed that in Elliot terms, this correction should take the form of a zig-zag, since the last correction in Nov 2010 was an obvious flat... i neglected to remember my Elliot principles that it could also be a triangle!!! It wasnt until a mypivots veteran here, P.T.emini mentioned it that i looked again!.. it can be seen on the daily charts but is most evident on the hourly charts. Kudos, P.T., i believe you may have nailed it! If so, we may have made wave d at 1334.50 and declined into wave e friday at 1311.50. Since these triangle waves should be a-b-c's, its possible that a (of e) was 1334.50 to 1311.50 and b(of e) ran up to 1322 late in the session Friday. So one more possible move down to c(of e) to complete the triangle at c=.618 a at 1307.75. This would be a nice 'gap fill' at 1308 satisfying gap support guys. The other scenerio is that e already completed at 1311.50. If we move much higher, say over 1325 that would be the best odds. The bearish thesis would be that we are still forming a zig-zag and that A down was from 1343 to 1292.50 and b up either hit at 1336.50 on 3/1 or just now is completing, ready for a vicious c wave down much lower!(if so, c=a at 1284-1286 and of course c could =1.382 or 1.618 a for much lower! )So you can see the importance of the next few trading sessions! Please keep in mind that i could be completely wrong on all of these views,and make your own trading decisions. First ,lets look at a daily chart...
Click image for original size
roofer, I would tend to agree with your general concern / warning.
When looking for a trend reversal, one thing I look for and do see now is divergences (from a Dow theory perspective). What we see here is the leading commodity currency, the Aussie Dollar ( 6A ) failing to confirm the moves to new highs in GC, SI, CL & 6E (and new lows in the US Dollar). That is a big red flag for me especially so with Gold and Silver gapping up this morning to new highs. The normal pattern is for the 6A to lead or at least confirm breakouts, and this normal pattern is not confirming. Until the 6A breaks above 1.02, I view the current hyper-bullish sentiment with caution. So either the 6A plays catch-up and sync's back up with it's peers at new highs early this week, or the 6A is the canary in the coal mine in which case hyper-bulls need to run for cover. The extreme levels of bullish sentiment are reason alone for extra caution.
Another area of non-confirmation exists in the TN & ZB treasury bond market charts. The TN has re-tested its recent trend low's, on a daily chart basis, but that low has held firm and a bid is coming into the treasury bond market. This set's up yet another potential divergence from the dollar trend to new lows.
Some readers might be saying that's all well and good but how does any of it relate back to the ES ? Up until the end of Feb/early Mar, volatility was being expressed through the above mentioned markets. When CL "launched" into this new uptrend in late February, putting the recent high into the ES, more normal volatility has (finally) returned to the ES (see kool's VIX chart above). If money starts flowing into the TN bid in earnest, it will tend to attract new money flows from the ES. And likewise, if the 6A holds firm putting a top into the currencies (and a low into the US Dollar), that will certainly drive volatility back into the ES.
Click image for original size
Nice post, PT. I just love intermarket dynamics. Most daytraders say I think too much, but I don't like to trade, even intraday, without watching the intermarket dynamics very closely. Then, again, I'm an 'intraday swing trader' when I 'daytrade', not a 'scalper', so that may be a big part of it, too.
Emini Day Trading /
Daily Notes /
Forecast /
Economic Events /
Search /
Terms and Conditions /
Disclaimer /
Books /
Online Books /
Site Map /
Contact /
Privacy Policy /
Links /
About /
Day Trading Forum /
Investment Calculators /
Pivot Point Calculator /
Market Profile Generator /
Fibonacci Calculator /
Mailing List /
Advertise Here /
Articles /
Financial Terms /
Brokers /
Software /
Holidays /
Stock Split Calendar /
Mortgage Calculator /
Donate
Copyright © 2004-2023, MyPivots. All rights reserved.
Copyright © 2004-2023, MyPivots. All rights reserved.