ES weekend preview 3-5-11
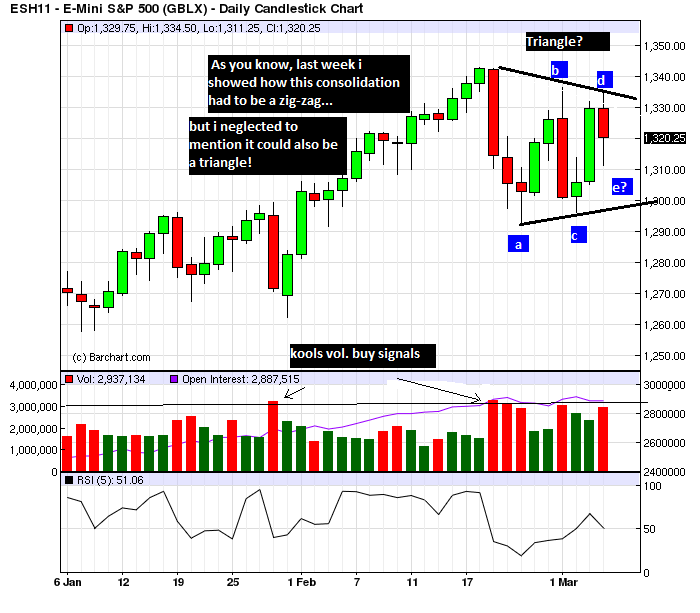
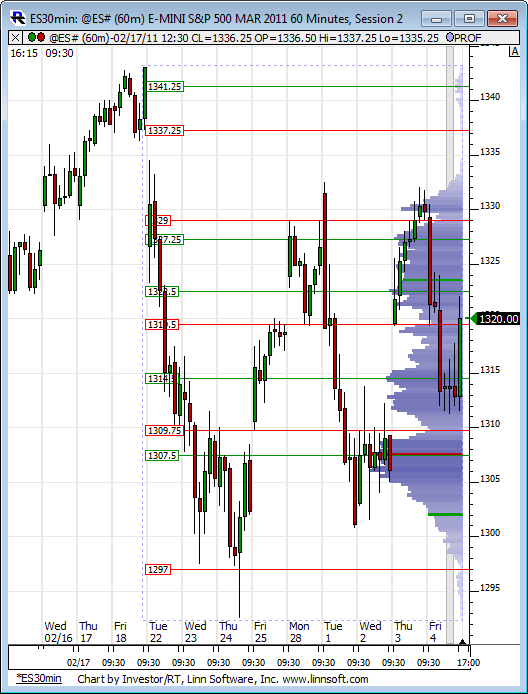
An exiting week is coming up. Some time ago i showed how the market MUST exceed 1257.25 before any big correction. I still believe that to be the case. I also showed that in Elliot terms, this correction should take the form of a zig-zag, since the last correction in Nov 2010 was an obvious flat... i neglected to remember my Elliot principles that it could also be a triangle!!! It wasnt until a mypivots veteran here, P.T.emini mentioned it that i looked again!.. it can be seen on the daily charts but is most evident on the hourly charts. Kudos, P.T., i believe you may have nailed it! If so, we may have made wave d at 1334.50 and declined into wave e friday at 1311.50. Since these triangle waves should be a-b-c's, its possible that a (of e) was 1334.50 to 1311.50 and b(of e) ran up to 1322 late in the session Friday. So one more possible move down to c(of e) to complete the triangle at c=.618 a at 1307.75. This would be a nice 'gap fill' at 1308 satisfying gap support guys. The other scenerio is that e already completed at 1311.50. If we move much higher, say over 1325 that would be the best odds. The bearish thesis would be that we are still forming a zig-zag and that A down was from 1343 to 1292.50 and b up either hit at 1336.50 on 3/1 or just now is completing, ready for a vicious c wave down much lower!(if so, c=a at 1284-1286 and of course c could =1.382 or 1.618 a for much lower! )So you can see the importance of the next few trading sessions! Please keep in mind that i could be completely wrong on all of these views,and make your own trading decisions. First ,lets look at a daily chart...
Click image for original size
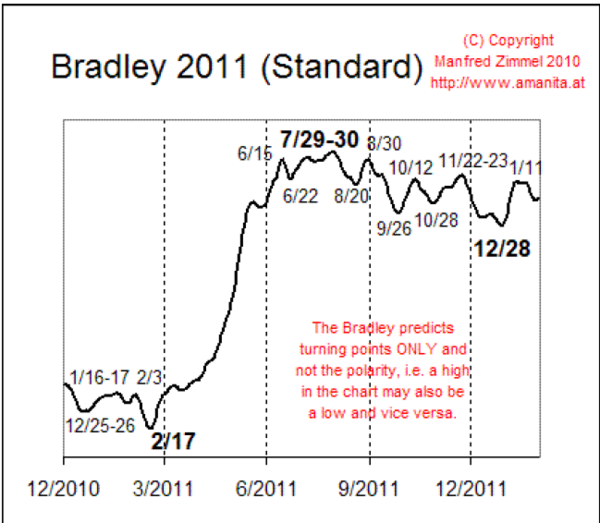
Remember the Bradley chart i showed at the start of the year? Go back and see if 2/17 wasnt very close to an important turning point!..next biggie is in June and then late July....
Click image for original size
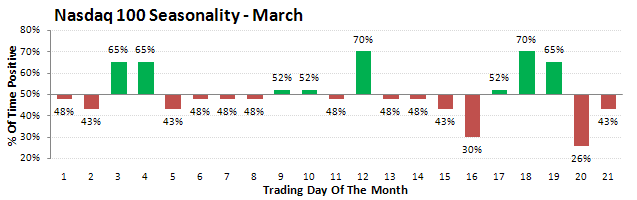
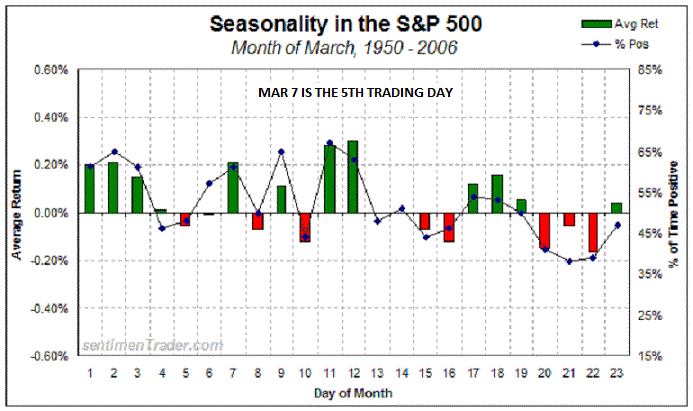
Now to the shorter term... heres what seasonals are saying about next week. It doesnt appear to be all that positive...
Click image for original size
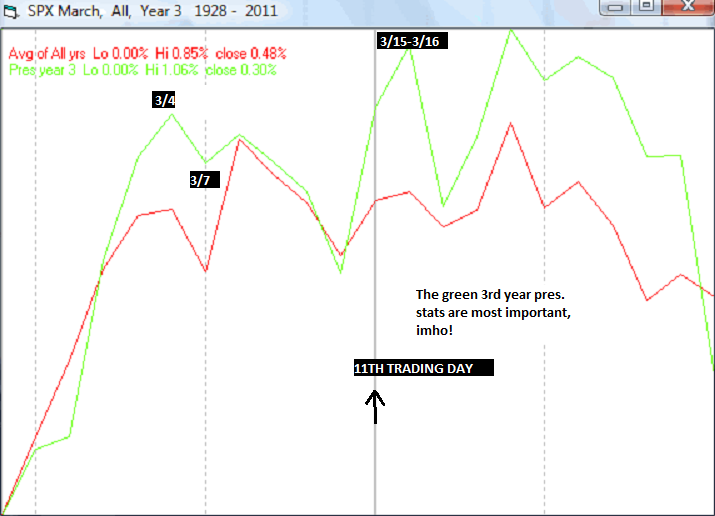
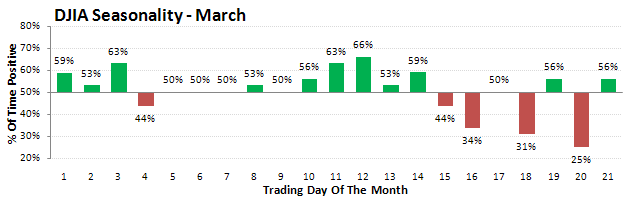
especially if you look at the Dow or Nas seasonals..(courtesy sentimentrader)..
Click image for original size
..Click image for original size
Remember ,Monday is the 5th trading day of the month. And remember the historical tendancy of the market to make turning points around the 5th or 6th day of the month!....
Click image for original size
So in summary: the next few days should give a clue as to whether the triangle (if it even is one) breaks up to new highs or down to lower prices. Either way, much higher prices into April or June are expected! GOOD TRADING ALL!
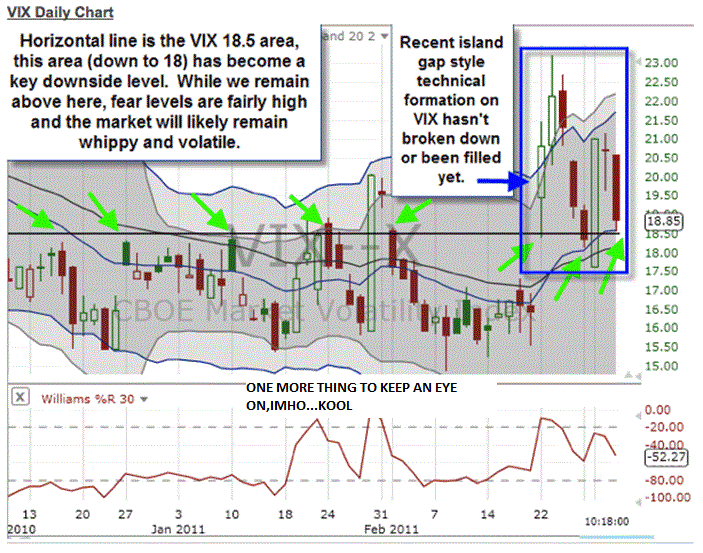
HERES AN INTERESTING CHART (courtesy the money store) to watch for longer term trend changes...
Click image for original size
kool... nice work... this weekend i spent hours at the kane forum showing the potential for price to go a lot lower (a crash) before it goes much higher... i showed chart after chart i made my case.... but bottom line all a trader needs to know is this... until price can get above the lines on this chart, the potential for a crash exists.hope i am wrong and you are right..roofer
Click image for original size
kool...if a crash does happen i will do the forum the courtesy of showing what my thinking was before it happened..... it is based on the same work that had me making a pound the table case for an explosion upward in oil prices at the kane forum a week before oil bottomed and on the day of the bottom i made a major chart post saying this is it.if i am wrong we can all have a good laugh at my concern... i just urge traders to be looking both ways at this moment in time..
Nice post, PT. I just love intermarket dynamics. Most daytraders say I think too much, but I don't like to trade, even intraday, without watching the intermarket dynamics very closely. Then, again, I'm an 'intraday swing trader' when I 'daytrade', not a 'scalper', so that may be a big part of it, too.
Emini Day Trading /
Daily Notes /
Forecast /
Economic Events /
Search /
Terms and Conditions /
Disclaimer /
Books /
Online Books /
Site Map /
Contact /
Privacy Policy /
Links /
About /
Day Trading Forum /
Investment Calculators /
Pivot Point Calculator /
Market Profile Generator /
Fibonacci Calculator /
Mailing List /
Advertise Here /
Articles /
Financial Terms /
Brokers /
Software /
Holidays /
Stock Split Calendar /
Mortgage Calculator /
Donate
Copyright © 2004-2023, MyPivots. All rights reserved.
Copyright © 2004-2023, MyPivots. All rights reserved.