ES short term trading 4-1-11
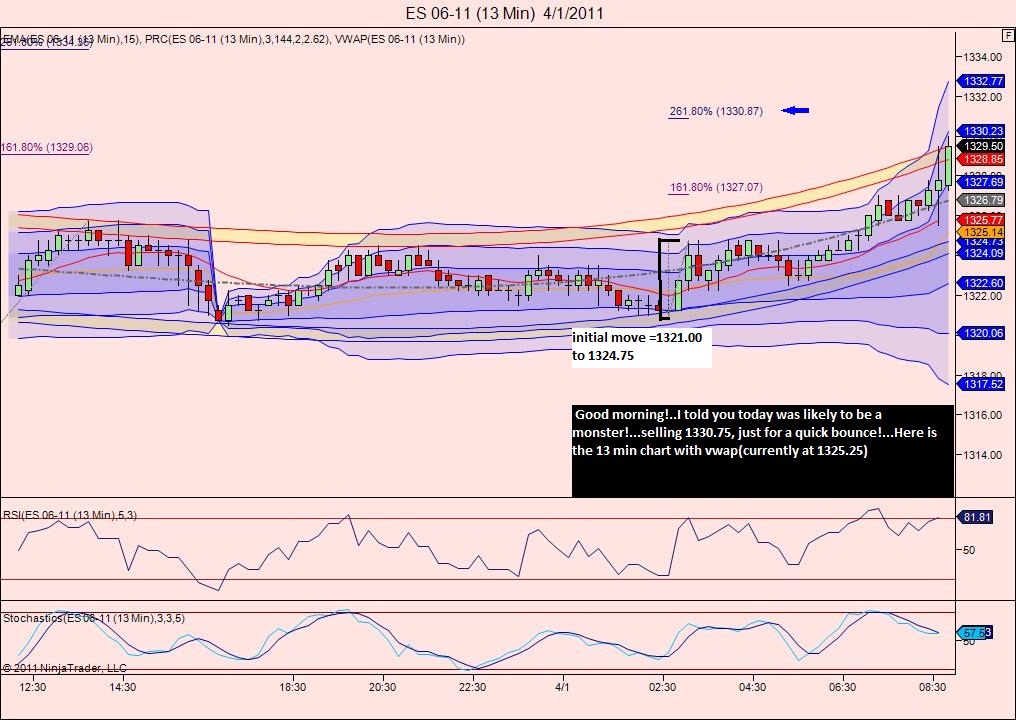
Good morning! Set for a wild open, eh! I thought i'd briefly touch on the thought process i have going into a typical trading session. First, as you may know i have a longer term bullish bias, thinking that 1241 was a supreme buying opportunity to an expected move up to 1426 at a minimum, probably by June. I am much more cautious shorter term however,feeling that a short term top may be overdue. So that the set up! Now for today! Yesterday i pointed out 2 days with a very tiny daily range in the es, would likely yield a big range (strong move) day very soon. The fact that today is unemployment day made that a no-brainer. lol. Anyway, being jobs day, remember ive shown in the past that , historically, its best to 'fade' the opening move! That means if we open down, you would want to buy! Conversely ,if we have a strong move up opening, that would be bearish!... i know thats hard to believe ,but thats just history! It certainly appears so far that the bearish scenerio,may be taking hold... in other words i'll likely be looking for shorts! And heres what im looking at as we come to the opening of the rth session...
Click image for original size
that was 3 on and all 3 off at 28.25......will wait for 10 a.m report
and welcome to the crazy Train Travelin......glad to have ya aboard and thanks for the positive vides...
out at 1328.50 on my runner..plus 2.25 there!... There are no easy trades, but thats probably as close as your gonna get!... would love to hold for closer to 1327 but gotta go!..back soon ,and good luck guys!
Just wanted to say thanks again for all the information... it was really great Bruce... you too lorn and of course Kool. you three really make a difference. i am still reading the info but think i got it so thank you again. Seems to be paying off, i a much different looking short term chart turn profitable already today!
i got a late start this morning but i will post what i think i learned a little later on to make sure i understand it correctly
but i can say i am holding on to a runner to 26.50.. where i found volume there and a 1.61 retrace.. hope i'm right
i got a late start this morning but i will post what i think i learned a little later on to make sure i understand it correctly
but i can say i am holding on to a runner to 26.50.. where i found volume there and a 1.61 retrace.. hope i'm right
Click image for original size
Click image for original size
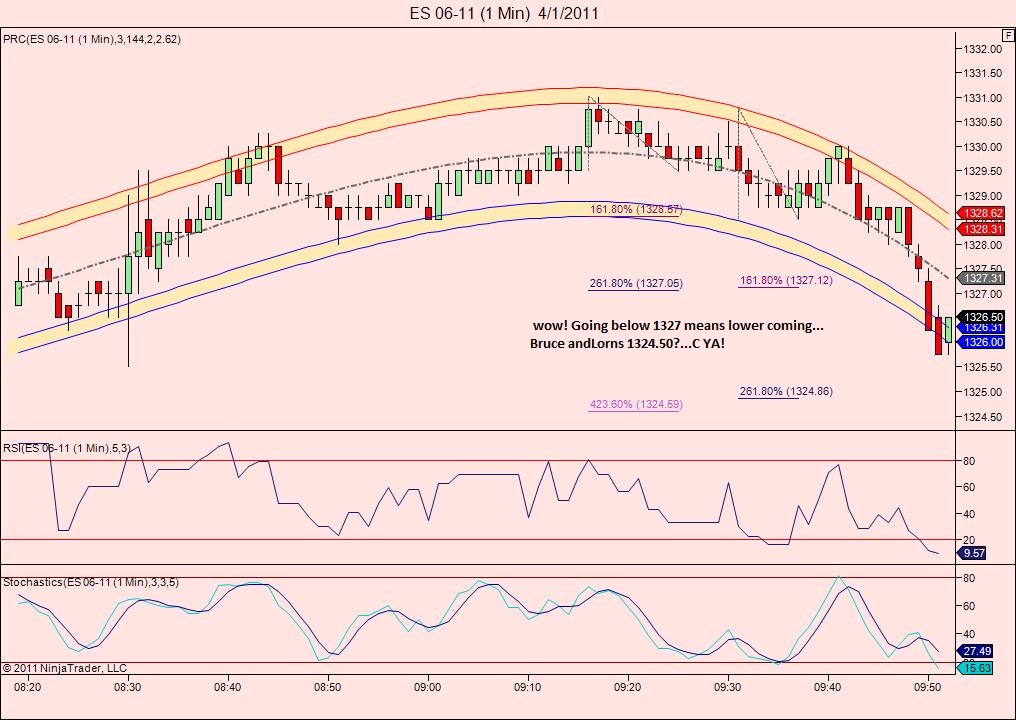
so far an open and drive type opening.....as long as we can hold back from going above 27.75 with volume we should go much lower......or at least down to the 24.50 area AND THYEN 20.50.....looking for sells on this pop up near 27.25 area
report in 3 minutes
report in 3 minutes
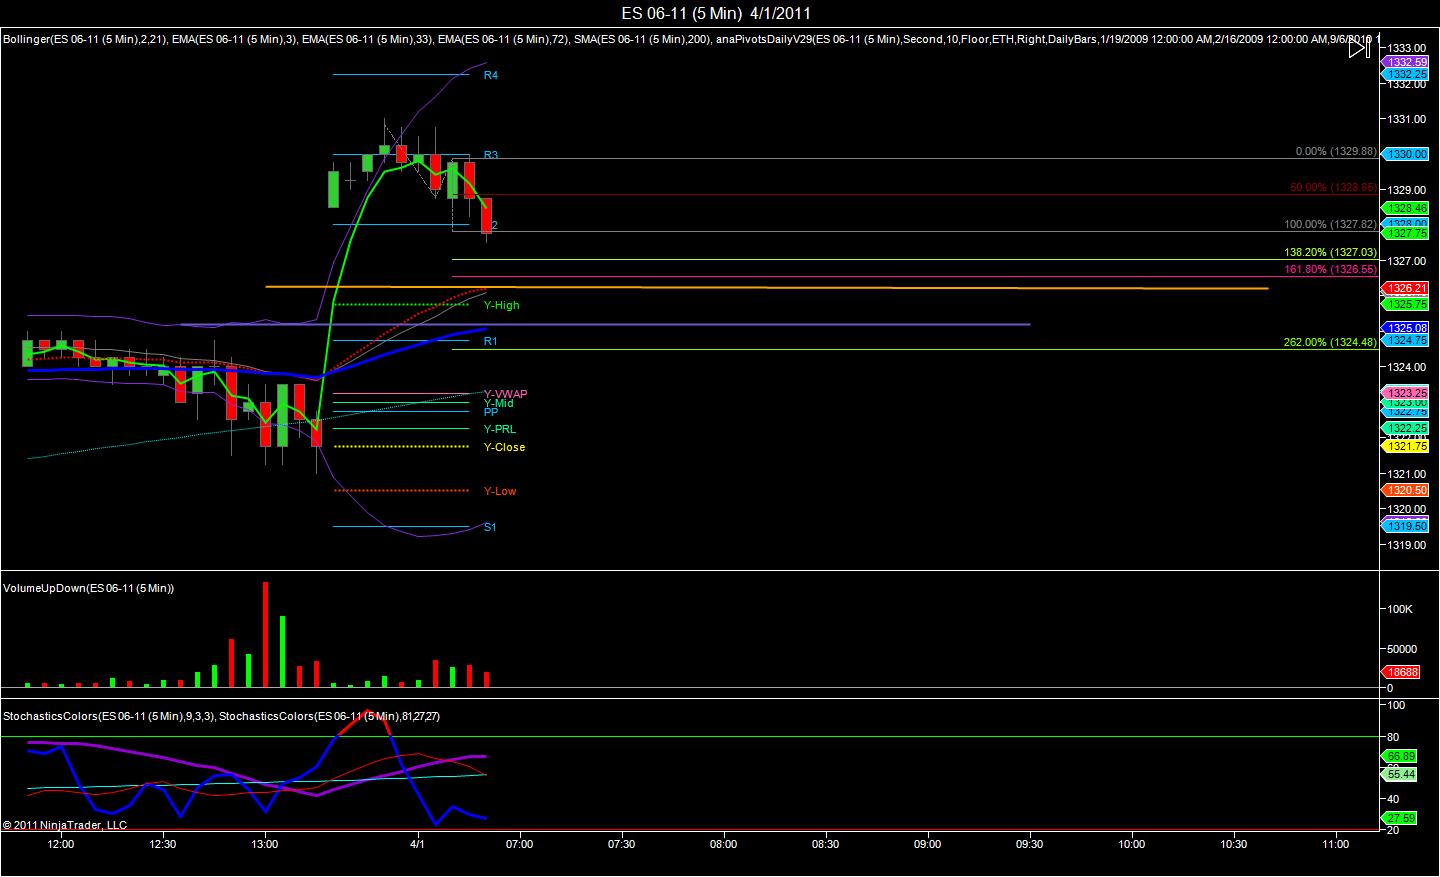
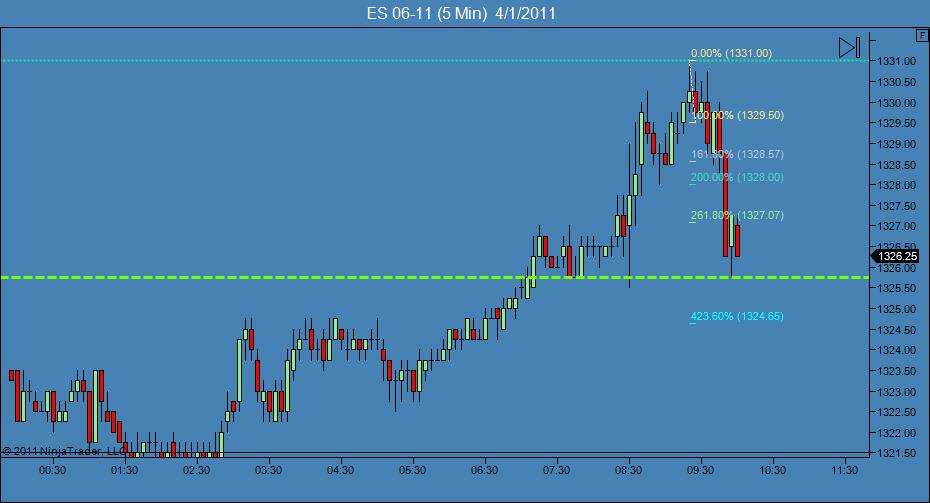
For visual reference OP. Here is a 5 min chart. The small dotted green line on top is the O/N high. The thick green dashed line is YD's RTH high. We have had a bounce off RTH high but as you can see from the projection most likely lower numbers to come or at least a challenge of YD's RTH high again to see if that bottom was for real.
Click image for original size
short into 27.75
Bruce , Lorn, Kool.. this post was for you guys. link is below
http://www.mypivots.com/board/topic/6576/-1/special-thanks-to-the-es-room
http://www.mypivots.com/board/topic/6576/-1/special-thanks-to-the-es-room
took loss at 28.75....trying again from 30 even....looking for 27.75...they may run O/N highs still
i'm at the office so i can't post a chart but if you look at early to mid Feb the market did the same thing when they hit the 1330 levels. There seems to be a brick wall at the 1333-1335 levels. Maybe someone could look into this and confirm?
My guess is there is balance between sellers and buyers at these levels and with no significant news or reports we will stay stagnate until that changes with earnings reports or other news.
with recent flar ups of trouble in jordan and the middle east,our own senate not able to agree on a budget, i would suspect the market is approaching higher levels a little cautiously to see what happnes over the weekend.
Emini Day Trading /
Daily Notes /
Forecast /
Economic Events /
Search /
Terms and Conditions /
Disclaimer /
Books /
Online Books /
Site Map /
Contact /
Privacy Policy /
Links /
About /
Day Trading Forum /
Investment Calculators /
Pivot Point Calculator /
Market Profile Generator /
Fibonacci Calculator /
Mailing List /
Advertise Here /
Articles /
Financial Terms /
Brokers /
Software /
Holidays /
Stock Split Calendar /
Mortgage Calculator /
Donate
Copyright © 2004-2023, MyPivots. All rights reserved.
Copyright © 2004-2023, MyPivots. All rights reserved.