ES Short Term Trading for 4-25-11
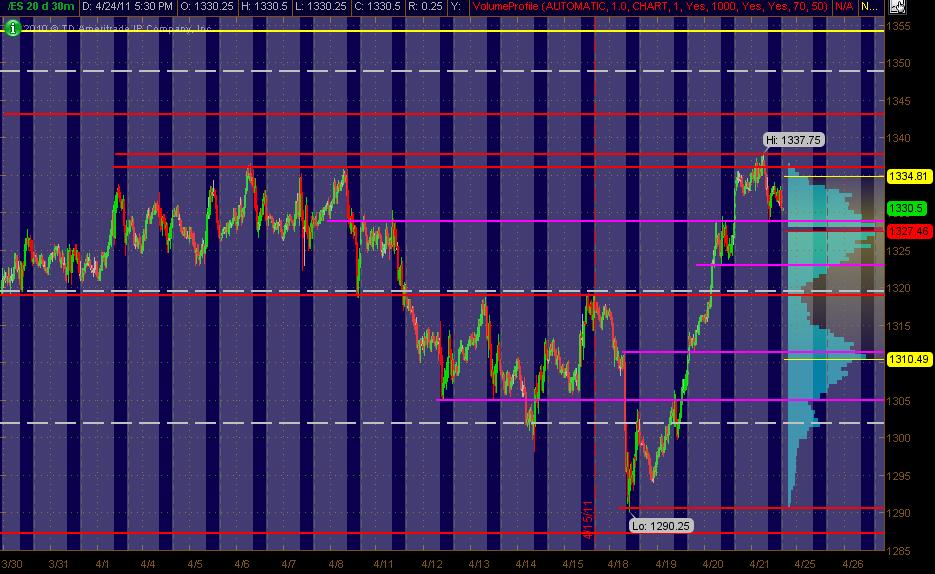
Here's my MonkeyMap of the ES 30min chart of 20 days. The Gray background is the "overnight" trading. The right vertical axis shows the 20-days worth of Volume at Price in Light Blue. The Red lines are my PASR "zones" of potential S/R with the Magenta potential semi-significant. The White dashed lines are the Weekly Pivots. Have a Yellow line above the current market that looks like a potential significant Fib cluster area to me. I've adjusted some of the lines/levels/zones from mid-week last week. Hope some folks find this helpful as a MAP!
Click image for original size
Sorry, attached wrong chart for the last post
Click image for original size
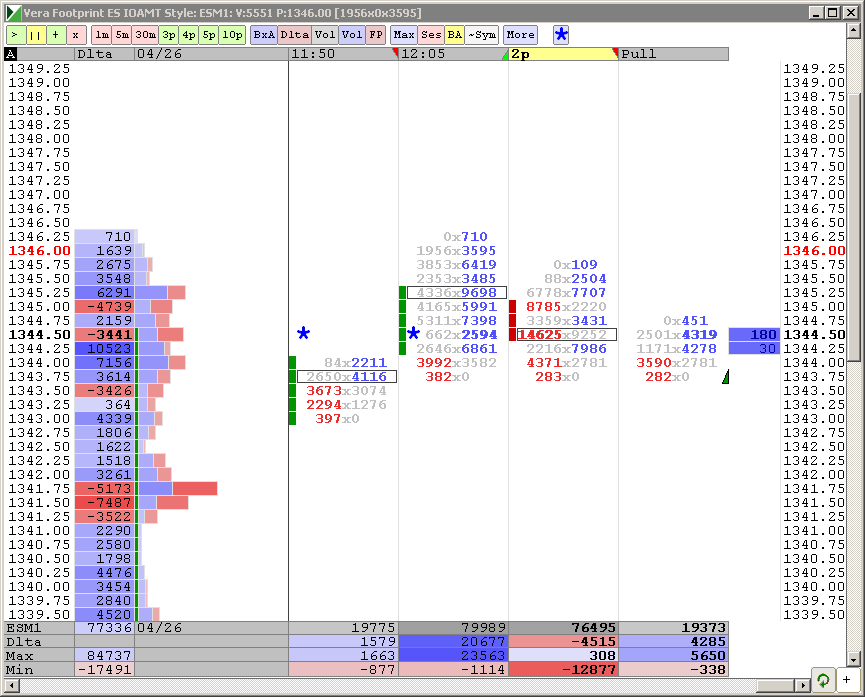
20,000 more hit the bid at 1344
Emini Day Trading /
Daily Notes /
Forecast /
Economic Events /
Search /
Terms and Conditions /
Disclaimer /
Books /
Online Books /
Site Map /
Contact /
Privacy Policy /
Links /
About /
Day Trading Forum /
Investment Calculators /
Pivot Point Calculator /
Market Profile Generator /
Fibonacci Calculator /
Mailing List /
Advertise Here /
Articles /
Financial Terms /
Brokers /
Software /
Holidays /
Stock Split Calendar /
Mortgage Calculator /
Donate
Copyright © 2004-2023, MyPivots. All rights reserved.
Copyright © 2004-2023, MyPivots. All rights reserved.