ES Monkey MAP for 5-2-11
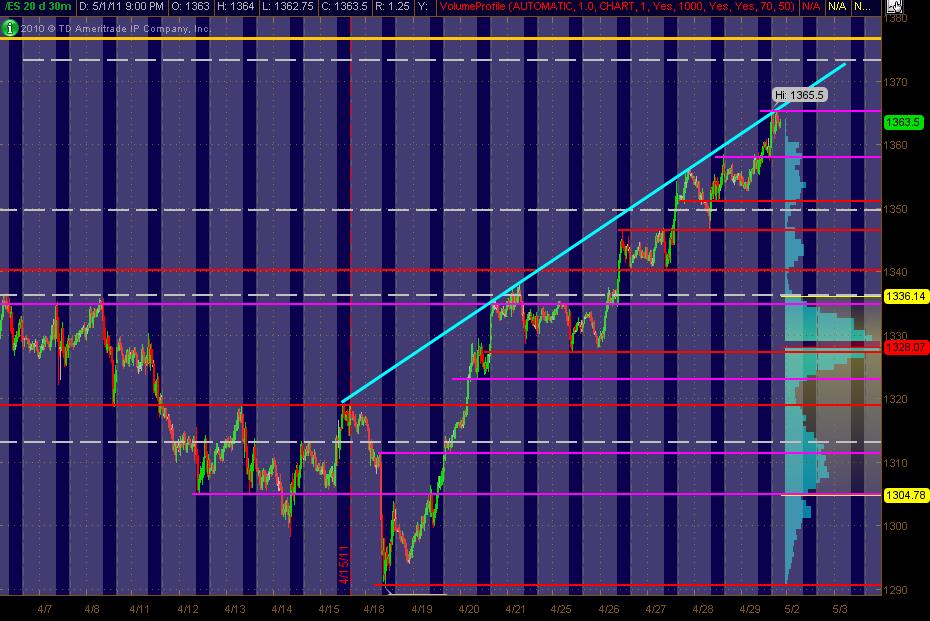
Here's my 30min MAP that I'll be looking at with the Red lines as potential PASR levels with Magenta as semi-significant. The White dashed lines are Weekly Pivots. The Yellow line above the current market is what I have as a potential significant Fib cluster. Also, have a Cyan trend line that's been holding for a while across the top of the price high swing activity on this time frame so far. Hope this is helpful to some folks!
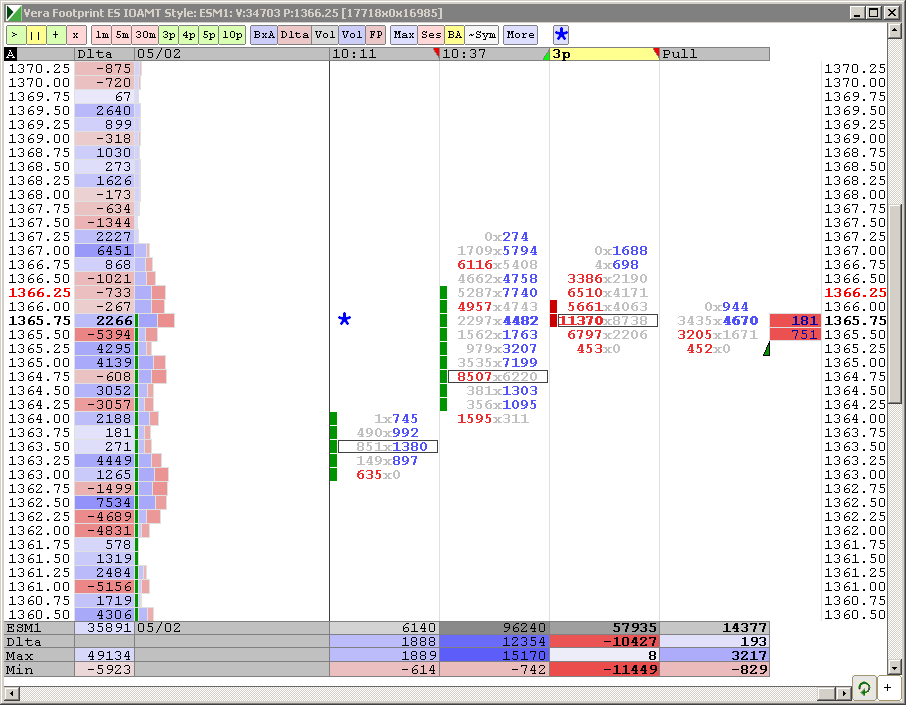
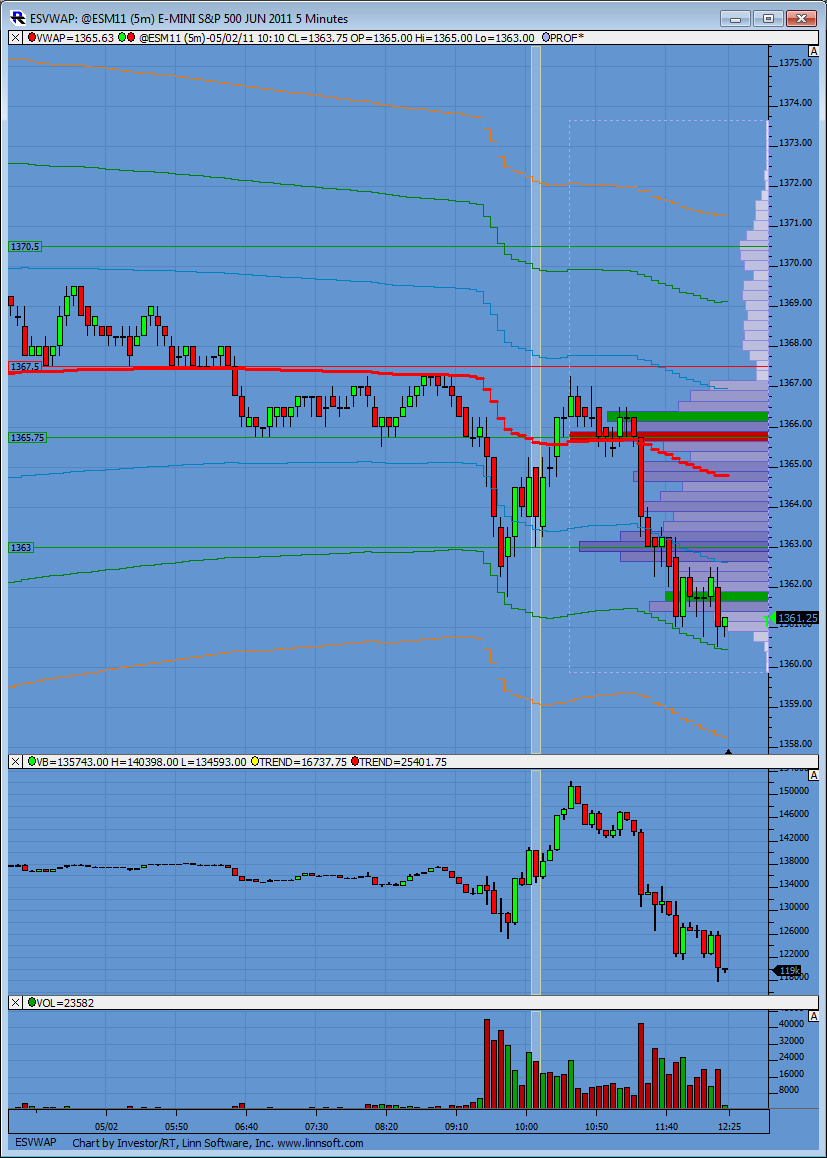
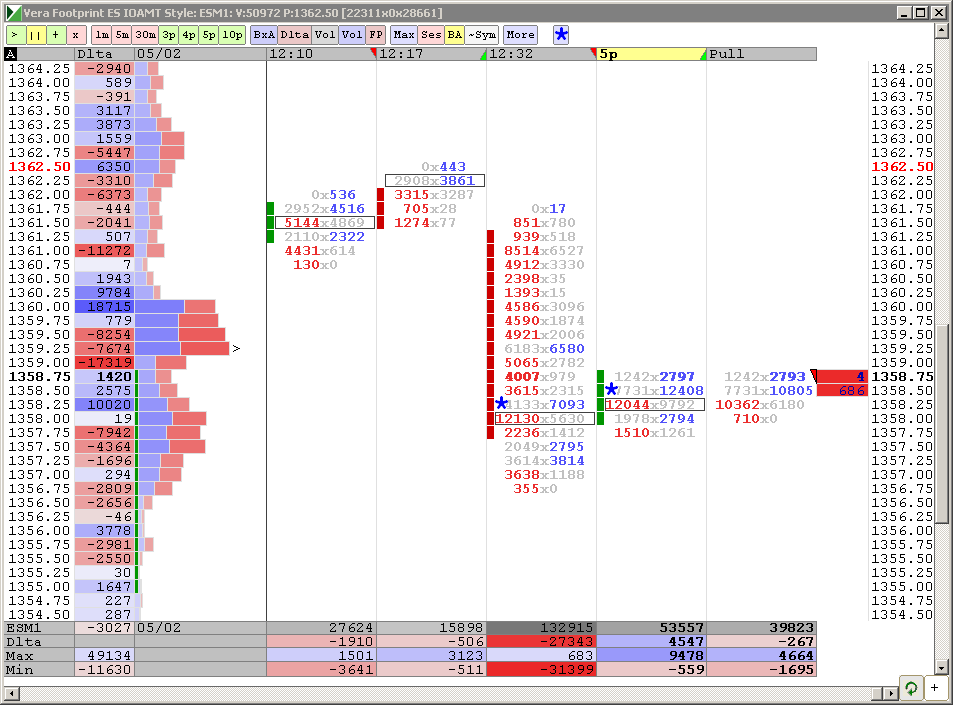
Here's what I've got (TOS) Volume Profile coming into Monday's trading ... btw, thanks for your feedback Lorn on my prior post about how it was matching up with your data!!
Top Left: 5min chart of 2 days data ATH
Top Right: 5min chart of 2 days data RTH
Bottom Left: 5min chart of 1 days data ATH
Bottom Right: 30min chart of 2 days data ATH
Again, hope this is useful to all!
Top Left: 5min chart of 2 days data ATH
Top Right: 5min chart of 2 days data RTH
Bottom Left: 5min chart of 1 days data ATH
Bottom Right: 30min chart of 2 days data ATH
Again, hope this is useful to all!
AND THE MARKET JUST SPIKED AFTER I POSTED ... WHILE I HAD THE NEWS on AND IT LOOKS LIKE WE FINALLY GOT THE MO$&ER F&CK#R ... Osama ... prez is supposed to speak in a few minutes ... hope that's the statement. If so a big @ssed Monkey Meat HOOOOOOOOT!!!!!!!!!!! Never know for sure though.
Lorn, where is your LVA now, please?
Are you looking for intra-day or longer term?
Originally posted by Lisa P
Lorn, where is your LVA now, please?
Intraday, was just trying to check my numbers.
BTW, thanks for your chart posts.
BTW, thanks for your chart posts.
MM, thanks to you too - very useful charts
should be interesting close to see fighting over outside bearish reversal bar....
Emini Day Trading /
Daily Notes /
Forecast /
Economic Events /
Search /
Terms and Conditions /
Disclaimer /
Books /
Online Books /
Site Map /
Contact /
Privacy Policy /
Links /
About /
Day Trading Forum /
Investment Calculators /
Pivot Point Calculator /
Market Profile Generator /
Fibonacci Calculator /
Mailing List /
Advertise Here /
Articles /
Financial Terms /
Brokers /
Software /
Holidays /
Stock Split Calendar /
Mortgage Calculator /
Donate
Copyright © 2004-2023, MyPivots. All rights reserved.
Copyright © 2004-2023, MyPivots. All rights reserved.


