ES 5-13-2011
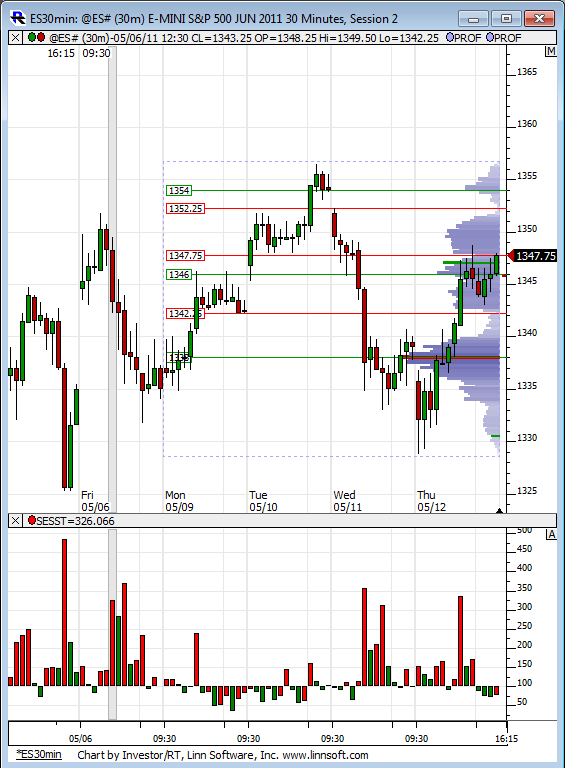
Friday the 13th! Today some above average volume to the upside. Gap still open to 1354. Lets see what she can do.
Click image for original size
Originally posted by BruceM
Thanks....Hopefully anyone reading can understand the power of high Volume nodes and of the key ranges ( The On and day session) This is starting to look ugly...
I'm not sure my way of looking at the value area is quite as accurate or sophisticated as others here, but another way to look at it is that I have a value area from 1346.50 down to 1332. Once we got solidly within that range, odds are that it wants to go to the other side of the range. Thus, we made it down to 1332 (and a little more).
Originally posted by neoikon
I'm not sure my way of looking at the value area is quite as accurate or sophisticated as others here, but another way to look at it is that I have a value area from 1346.50 down to 1332. Once we got solidly within that range, odds are that it wants to go to the other side of the range. Thus, we made it down to 1332 (and a little more).
I wish there was a way I could just edit my post instead of adding new, but here is the idea I was trying to describe: http://www.trading-naked.com/library/DOW%20Mini%20-%20Value%20Area.pdf
that is useful material but I suggest traders do their own homework especially on the 80% rule as it is my experience that it is not a true probability.....but knowing the concept and holding inside or outside of value is a critical idea....we can think of the Value area just like any other range.....
Sorry, but I must try again.... Now were looking at possible trips! Yes or no?
Dang too late. I just want to find something. I was close. Yes?
I don't see three 5 minute bars in a row with matching highs or lows...so my answer would have to be 'No"
Originally posted by BruceM
I don't see three 5 minute bars in a row with macthing highs or lows...so my answer would have to be 'No"
By Chance did you see the two with matching highs and lows, as to where the third dropped just before it changed, but it does have matching highs? Wish I could post a photo.
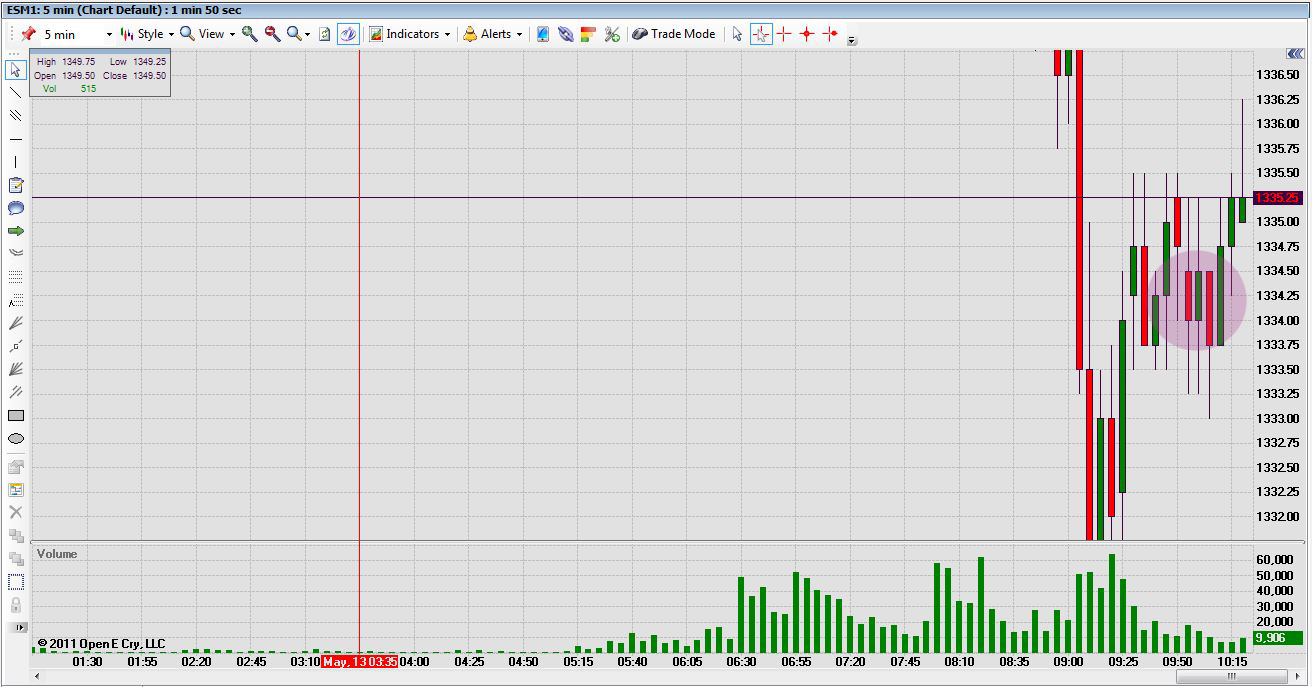
5 minute chart. Three level bars. Please tell me what I'm missing here. I'm concerned if my 5 minute chart is different than everyone else.
Click image for original size
Originally posted by TradeQueen
5 minute chart. Three level bars. Please tell me what I'm missing here. I'm concerned if my 5 minute chart is different than everyone else.
It seems you are looking at the open/close rather than the highs/lows. In this case, it would be the bottom of the wicks. Those are two that are the same at 33.25, but the third drops to 33 even, thus nullifying the "triple"
That is correct you need to look at the highs and lows...the opens and closes have no meaning when it comes to triples..
Originally posted by neoikon
Originally posted by TradeQueen
5 minute chart. Three level bars. Please tell me what I'm missing here. I'm concerned if my 5 minute chart is different than everyone else.
It seems you are looking at the open/close rather than the highs/lows. In this case, it would be the bottom of the wicks. Those are two that are the same at 33.25, but the third drops to 33 even, thus nullifying the "triple"
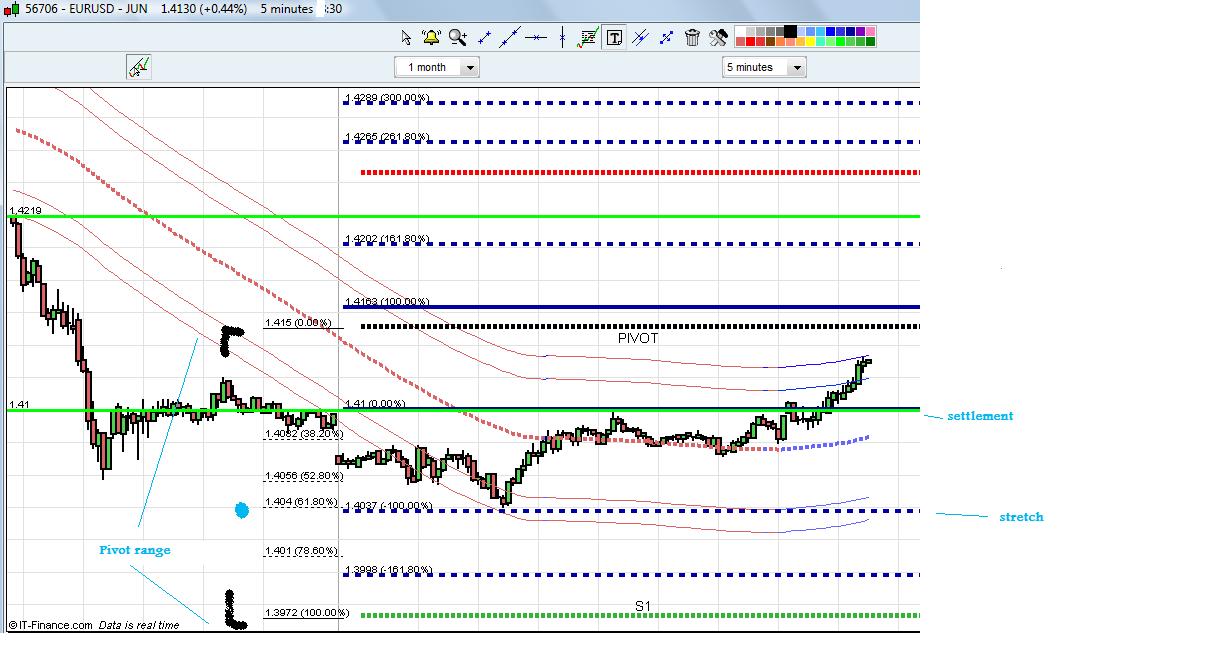
one for neoikon. I was playing around with your pivot retracements over the weekend and they are useful, here is EURUSD about 10min ago, respecting the stretch and 61.8 of pivot range. Very cool
Click image for original size
Emini Day Trading /
Daily Notes /
Forecast /
Economic Events /
Search /
Terms and Conditions /
Disclaimer /
Books /
Online Books /
Site Map /
Contact /
Privacy Policy /
Links /
About /
Day Trading Forum /
Investment Calculators /
Pivot Point Calculator /
Market Profile Generator /
Fibonacci Calculator /
Mailing List /
Advertise Here /
Articles /
Financial Terms /
Brokers /
Software /
Holidays /
Stock Split Calendar /
Mortgage Calculator /
Donate
Copyright © 2004-2023, MyPivots. All rights reserved.
Copyright © 2004-2023, MyPivots. All rights reserved.