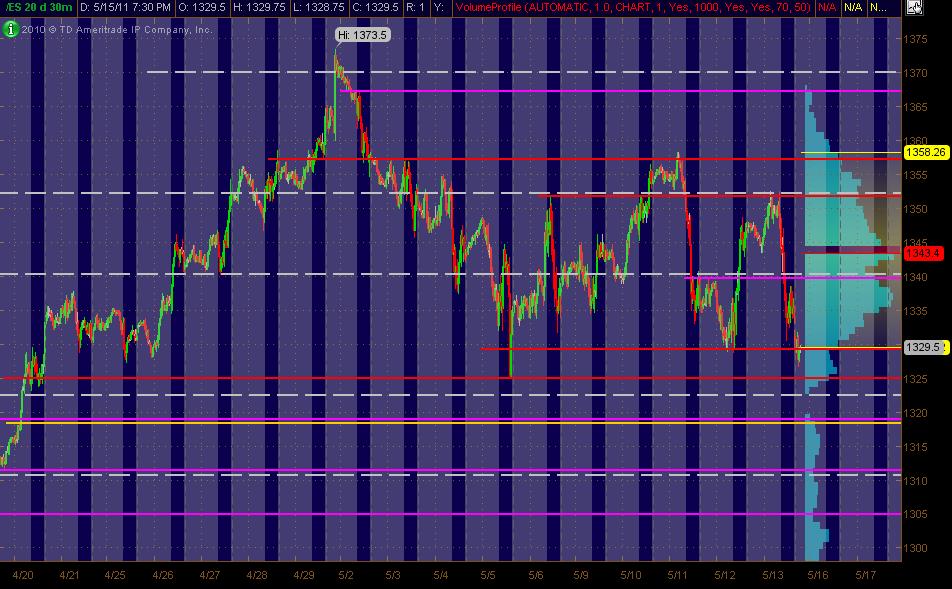
Here's my 30min MAP of 20 trading days that I've got with the Red lines as potential significant PASR levels with Magenta as semi-significant. The White dashed lines are Weekly Pivots. I've also got a Yellow line in the 1318-19 zone that's a Fib Cluster, fwiw. The Gray background is "overnight trading" and the Light Blue bars on the right vertical axis represent Volume at Price. Hope this is helpful to some folks!
TR
TradeQueen
Rep: 879
Posts: 204
Everybody is bailing out today. I just wanted to give thanks for everyones input. Played with pivot for the first time, the info today was VERY helpful.
Many many thanks!
Many many thanks!
TR
TradeQueen
Rep: 879
Posts: 204
Originally posted by neoikon
Hitting PP now (1339). Expecting it to fail.
And by fail, I mean fail at acting as resistance.
Thanks for reaffirming this. I had two PP's set for the day, although I did not trade.
The first was auto generated that I believe calculates the last RTH.
The second I manually generated for the o/n range from 12:01 to 6am.
My RTH PP was 1339 which matched yours. Thank you for that info.
I'm not confident that my O/N generated PP is of the norm, but the day hit the marks beautifully!
My R1 is 1334.25
My R2 is 1337.00
at 12:30pm eastern market is currently 1335.25 which is within the range of BruceM last post.
Apologies if I should of posted this in my Journal, but I'm hoping the info is relevant enough for open discussion here.
Again many thanks for everyone today.
Direct criticism is openly welcome. I can take it. I only get defensive if I get a laughing and pointing feeling. My friends say I need to toughen up!
I'm babbling... my que to rest.
NE
neoikon
Rep: 890
Posts: 173
Originally posted by TradeQueen
My RTH PP was 1339 which matched yours. Thank you for that info.
I'm not confident that my O/N generated PP is of the norm, but the day hit the marks beautifully!
My R1 is 1334.25
My R2 is 1337.00
at 12:30pm eastern market is currently 1335.25 which is within the range of BruceM last post.
How are you calculating the pivots? (if you use eSignal, I can point you to some scripts to do it automatically. Otherwise, there is always this calculator: http://www.mypivots.com/calculators/pivot-point-calculator.aspx )
I'm not sure how you calculated your R1 and R2. "R" or "Resistance" levels will always be above the PP. "S" or "Support" will always be below the PP. Perhaps you means S1 and S2 since those values are lower than the PP (1339).
However, my S1 is at 1325.50.
I personally don't have separate pivot levels based on just O/N movement (but perhaps I should!). I just use the previous day's numbers.
Just to make things more confusing the "Weekly" PP is at 1340.25, which could've help with the resistance up there.
NE
neoikon
Rep: 890
Posts: 173
Not sure why the pivot point calc link doesn't seem to work
http://www.mypivots.com/calculators/pivot-point-calculator.aspx
Basically, you get there from "Calculators" menu (on this site) and then the "pivot point calculator".
http://www.mypivots.com/calculators/pivot-point-calculator.aspx
Basically, you get there from "Calculators" menu (on this site) and then the "pivot point calculator".
TR
TradeQueen
Rep: 879
Posts: 204
Understand at this point that everything I read is very cloudy. Getting better, but very cloudy.
With that said, I believe... I've read in the past that BruceM, in the simplest form compares or has compared previous day RTH as well as over night O/N data. Sorry Bruce if I'm mistaken.
Basically, thats all I did this morning and I wasn't even sure this technique applied to Monday Morning. Chalk it up to beginners luck, because I wasn't confident enough to trade on in today. Plus I know darn well the rules will change tomorrow.
I didn't mention that my PP for the O/N data is 1330.25 which corresponded to BruceM mark... Thank you for that info...
Finally,
S1 for O/N is 1327.5
S2 for O/n is 1323.5
but 1330 seems to be the support for now.
You all can probably imagine how FUN it is for me to be discussing this, (for right or wrong)right now. It's just fun to be in it, because as of Friday... I was clueless on everything. Maybe I still am, but it seems I'm at least on the right track for the moment.
Hope I covered everything. Thanks Neo!
With that said, I believe... I've read in the past that BruceM, in the simplest form compares or has compared previous day RTH as well as over night O/N data. Sorry Bruce if I'm mistaken.
Basically, thats all I did this morning and I wasn't even sure this technique applied to Monday Morning. Chalk it up to beginners luck, because I wasn't confident enough to trade on in today. Plus I know darn well the rules will change tomorrow.
I didn't mention that my PP for the O/N data is 1330.25 which corresponded to BruceM mark... Thank you for that info...
Finally,
S1 for O/N is 1327.5
S2 for O/n is 1323.5
but 1330 seems to be the support for now.
You all can probably imagine how FUN it is for me to be discussing this, (for right or wrong)right now. It's just fun to be in it, because as of Friday... I was clueless on everything. Maybe I still am, but it seems I'm at least on the right track for the moment.
Hope I covered everything. Thanks Neo!
