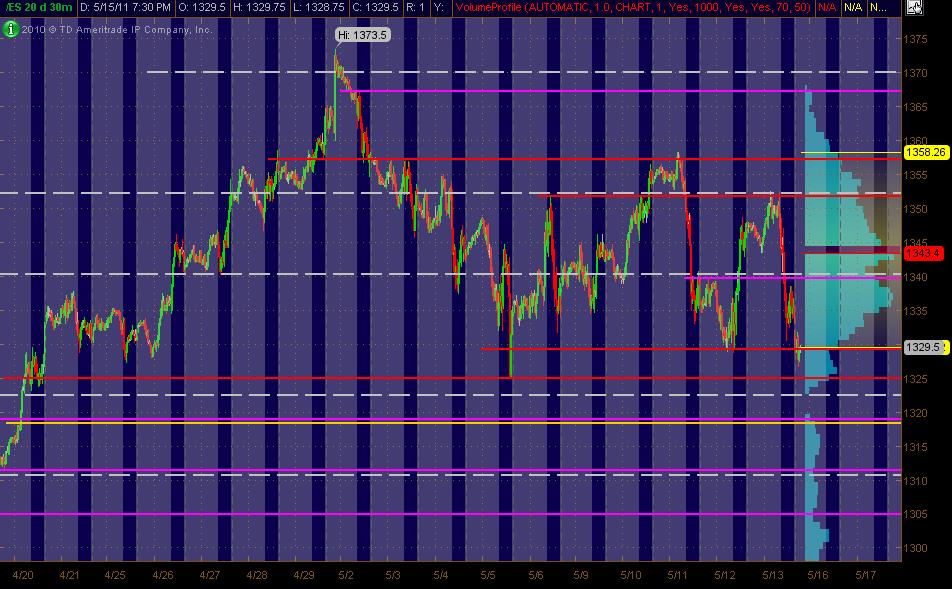
ES S/R Monkey Map for 5-16-11
Here's my 30min MAP of 20 trading days that I've got with the Red lines as potential significant PASR levels with Magenta as semi-significant. The White dashed lines are Weekly Pivots. I've also got a Yellow line in the 1318-19 zone that's a Fib Cluster, fwiw. The Gray background is "overnight trading" and the Light Blue bars on the right vertical axis represent Volume at Price. Hope this is helpful to some folks!
Click image for original size
short at 38.75
Originally posted by neoikon
Hitting PP now (1339). Expecting it to fail.
And by fail, I mean fail at acting as resistance.
looking to add at 40.25 now...and will look for retest of hour highs...trending trade so higher risk
Well I took the stop. -2. probably should have added and held, but just got out of the groove.
each 30 minute bar has showed lower and lower volume on the drive up today....still would have preferred to see a volume flush to shake out all the short faders..may still come...
I want to see this get and stay below 38.50 as that is Fridays afternoon highs and I had a distribution drawn between the low of Friday and the 38.50....so if this is to stay symetric we need to spend very little time above the 38.50 and drop back towards the center which would put us back to the 34 - 35 area again
That's what I expect but $tick needs to crumble so more
Unless we have a very strong trending day you will not see two sets of single prints as defined by 30 minute rules on the same day.....usually the second set gets filled in so trade back towards 37.25 SHOULD be an additional magnet to help us with this fade....
and if we keep trending then we lose...it's really that simple..!
and if we keep trending then we lose...it's really that simple..!
well, all the incredients seem to be here for a rollover down but it seems just a bit TOO obvious..I don't like the obvious....more pain equals more gain and so far it seems too easy..
but Volume and AD is fairly close ...so no screaming buying trend there....
would have prefeered to see that 11:30 close under 38.50...that is upper distribution zone of the symetric area
but Volume and AD is fairly close ...so no screaming buying trend there....
would have prefeered to see that 11:30 close under 38.50...that is upper distribution zone of the symetric area
and now it is official we have two sets of single prints as per 30 minute bars...
can't stay and play today so just covered at 37.50 print and just under the 60 minute highs at 36.50...I had 3 short from 38 and 6 from 40.25.....so exited all...
if I had the time I would have gone a bit heavier on the 40.25 's and would have tried to ride something back down to 34 - 35 ..that is the breakout point and the center of the distribution I am watching between 38.50 and 30.50....KEY prices now....careful there!!
After 13-14 years at the emini, I'm still a small fry when it comes to trading large numbers of contracts...It just doesn't work for me....and lord knows I have tried...unfortunately many I knew long ago blew out and no longer trade....I'm not bragging, just pointing out a sad truth......
I gotta run for now...good luck today
great trading bruce, and thanks for the effort of posting your thoughts
Originally posted by BruceM
hopefully u saw all the triples today TOO !!
You got to be kidding me! I was looking for'em. How'd I miss THAT! Right at the RTH open! You got me!
Emini Day Trading /
Daily Notes /
Forecast /
Economic Events /
Search /
Terms and Conditions /
Disclaimer /
Books /
Online Books /
Site Map /
Contact /
Privacy Policy /
Links /
About /
Day Trading Forum /
Investment Calculators /
Pivot Point Calculator /
Market Profile Generator /
Fibonacci Calculator /
Mailing List /
Advertise Here /
Articles /
Financial Terms /
Brokers /
Software /
Holidays /
Stock Split Calendar /
Mortgage Calculator /
Donate
Copyright © 2004-2023, MyPivots. All rights reserved.
Copyright © 2004-2023, MyPivots. All rights reserved.