The Genral Stretch Discussion Thread
Given that daily threads will be hard to look back on I thought it might be a good idea to have a general discussion thread on "The Stretch" and how to us it? why it works? and as per a post on the ES thread can it be improved on?
I'll not write an essay however a few thoughts to get things going, it does seem to identify ranges, so either its being traded by the market or it mimics moving averages or some other metric that the market uses? or its simply playing off and framing an average daily range?
It works in other markets, for instance Silver yesterday went to 261 then down to 300 and was very accurate at both points which was amazing given the volatitity and fast move.
I like it because it does 3 things for me, helps me not to get in early thus avoiding that last push that gets your stops, gives good targets to aim for, especially the fact that you have the settlement number, and you have clear stops so one should not suffer big drawdowns, so keeps the emotions in check.
Obviously one needs confirmation of the numbers so its worth having pivot points daily or weekly, Fib retracements off bigger ranges and whatever tool you like to measure momentum etc, MACD for example. plus moving averages and the rest.
Any flaws? it doesnt catch every high and low, yesterday for instance the low of the day on Dow exceeded the number by more then 5 points but given the clear double bottom I took the long anyway and used the +100% to close.
So over to you guys, and hopefully we can increase our understanding of this tool. Keep the daily threads going also and this one more for after hours discussion.
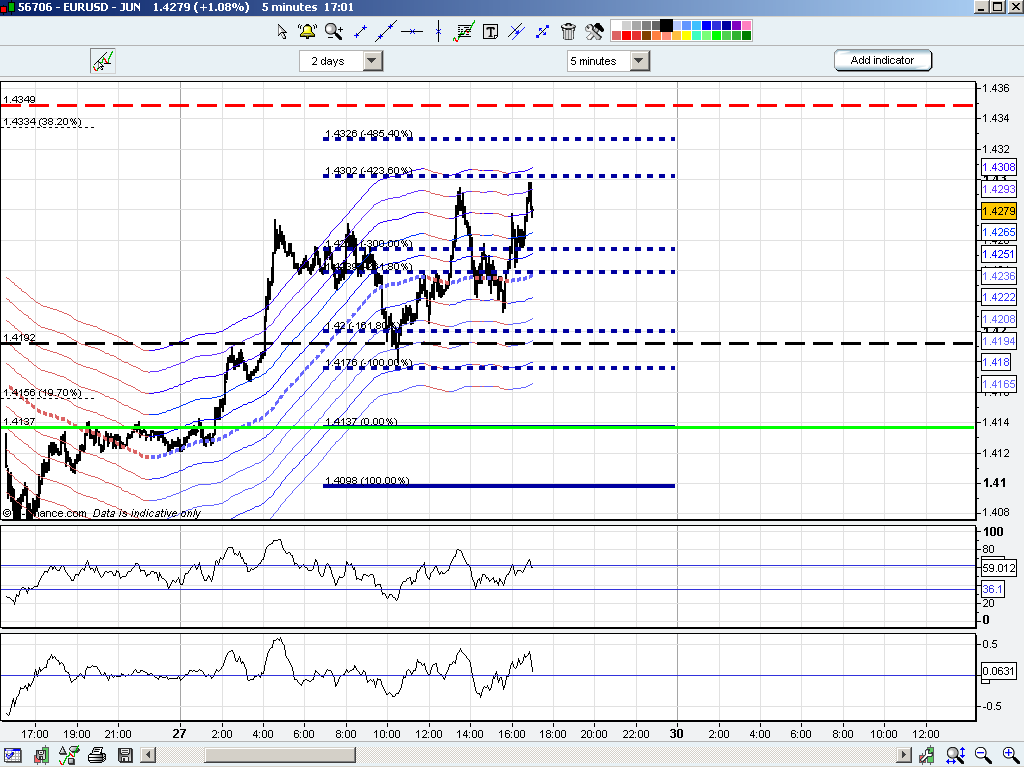
Updated EUR chart
Click image for original size
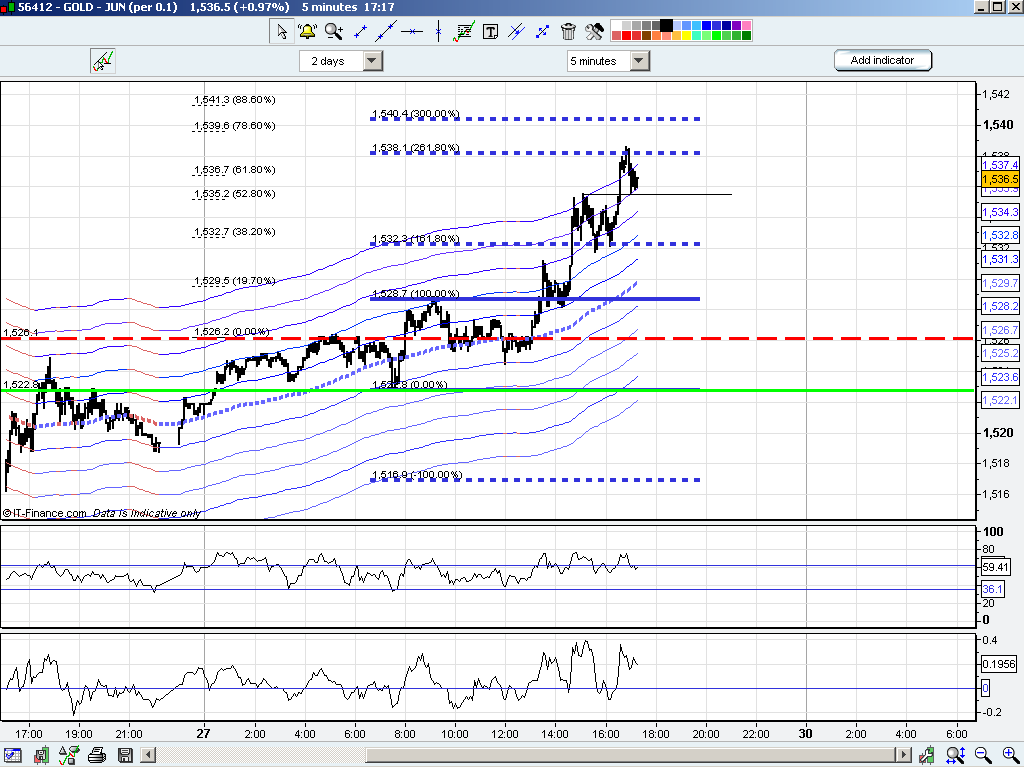
closed my short positions on gold and Dow , seems to be support in gold
Hunter I agree that 423 of anything will produce exhaustion as that usually represents very close to 3 standard deviations. So now that we have confirmed that, I can visualize from the prior settlement price, 4 lines drawn above and 4 below. The stretch 1.61,2.61, and now 4.23. Ok so now we get a new high between 1.61 and 2.61. As I read it we will now get 4 new lines on the down side. With 8 lines plus the prior settlement you have a pretty good shot of hitting something. How about some idea of what % of stop outs occur as price moves thru the stretch up to the 4.23. What I read is that I was smart enough to know at which line it was going to turn on.
Best wishes and good trading to all. RB
Best wishes and good trading to all. RB
also Dow found support 48 the 100%
Click image for original size
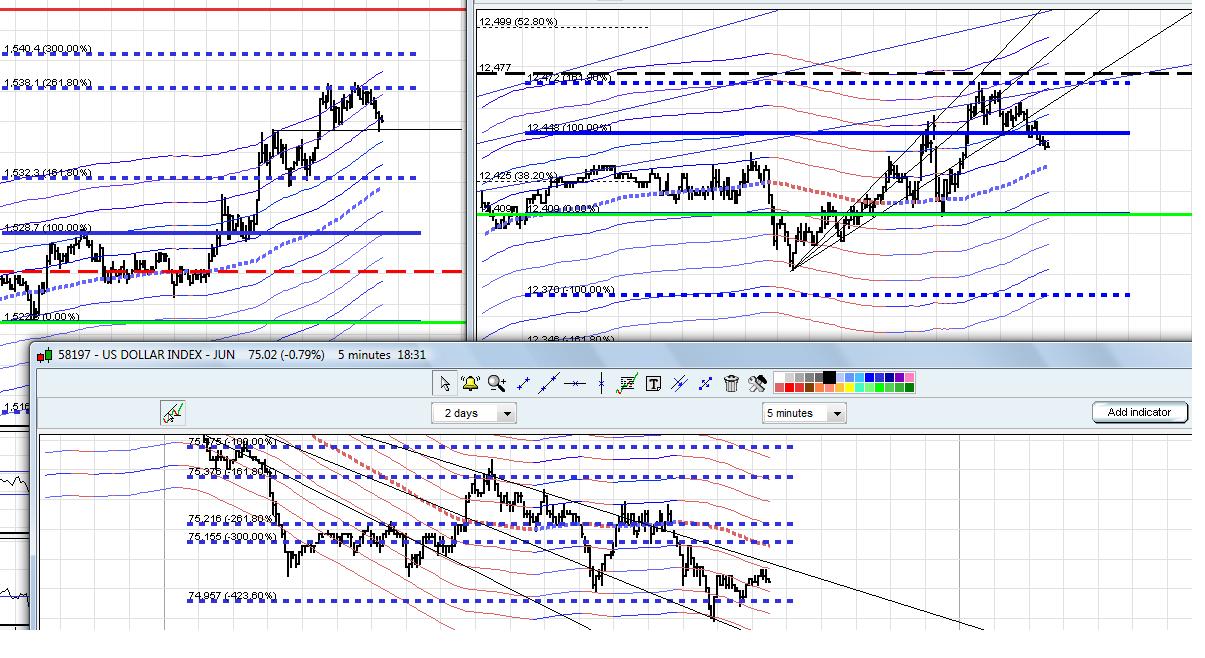
opened shorts again , DX looks like it tested low, just needs to break 75 to be sure
closed again, not looking impulsive , gold on left, dow right and DX bottom, thats 3days normal salary so far. he he!
Click image for original size
great trading silverharp !
Cheers! I think thats it for the day , dont want to be cannon fodder for the market makers!
next week whoever can create a daily thread if they want, and can leave this for general discussion
next week whoever can create a daily thread if they want, and can leave this for general discussion
Silverharp I see 18 lines on one chart above.
RB, I'm not trying to trade 18 lines though. My main focus is the 161 and the 261 and 300. As for the pivots you cant ignore them because the market uses them, the ones on my chart are weekly ones so they should be spread out a bit. If we get a confluence of a stretch number and a pivot so much the better. Once a trade is on, I've no idea how good the trade will be, it might be counter trend or just a slow day like today. You can use Fib or measured moves out of triangles for instance to get a target.
The other line that is interesting is the settlement number , notice how Dow found support at it today and stayed above it for the rest of the day. Your could probably come up with some setpiece trades off it. I have noticed that when price struggles underneath it can setup a great short trade for the rest of the session.
The other line that is interesting is the settlement number , notice how Dow found support at it today and stayed above it for the rest of the day. Your could probably come up with some setpiece trades off it. I have noticed that when price struggles underneath it can setup a great short trade for the rest of the session.
On the math, I would have to say.....use a stretch# that works.....
I don't trade manually and our stuff is built to run 24hours so humans would not be able to apply....too many rules.
But I'll try to translate.
In uptrends if the stretch has support....buy it and 1.61 and even 50% and 0% will work.
In downtrends is where you will see the deeper retracements 2.6, and 4.2...for longs. If the upper stretch is resistance sell it.....or the 1.6 level.....Not much diff...anyways.
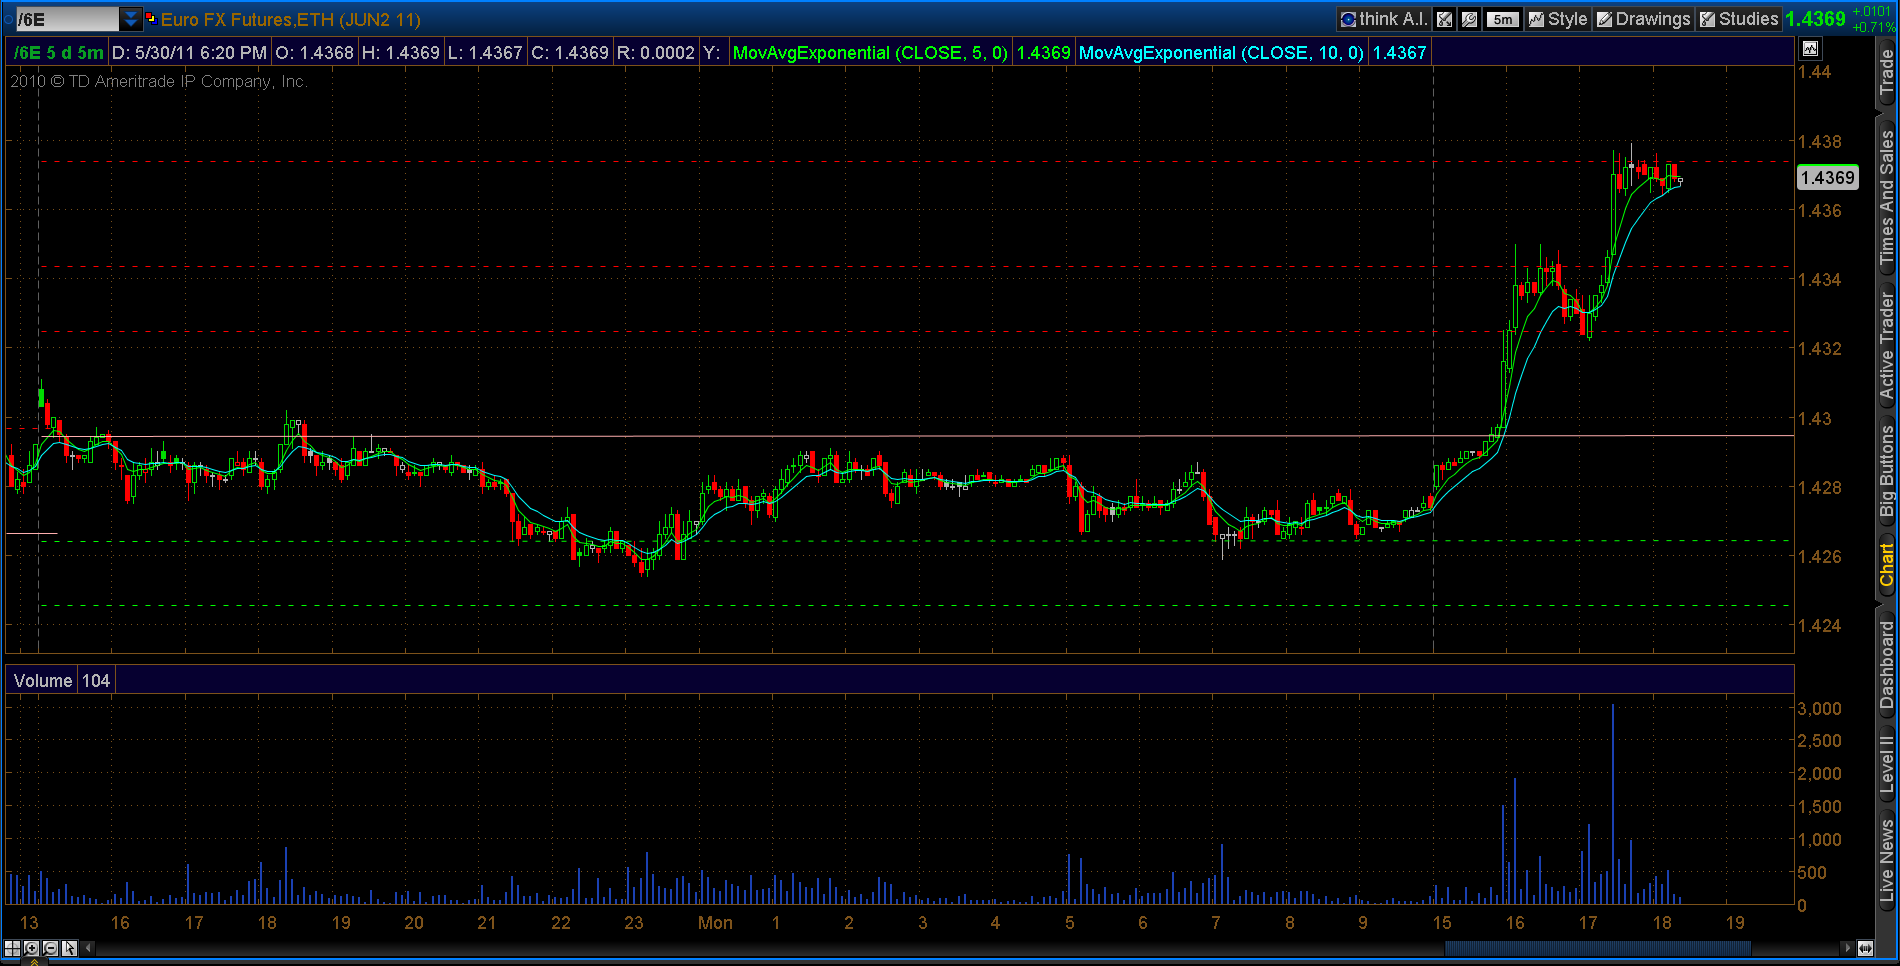
Here is an example of the EU today.....which is in an uptrend.
1. Support at the lower stretch for a long time (1st green dashed)...that would be a buy.
2. Movement through the previous close (pink)...good
3. Initial resistance at the 1.61 level (red2)
4. Back for support at the upper stretch (red1)
5. Blast to the 2.618 (red3) level which is now resistance.....but not necessarily a good short because of the uptrend.
Notice the accuracy......even on a visual model.
Hopefully that helps.....It works on everything.
I don't trade manually and our stuff is built to run 24hours so humans would not be able to apply....too many rules.
But I'll try to translate.
In uptrends if the stretch has support....buy it and 1.61 and even 50% and 0% will work.
In downtrends is where you will see the deeper retracements 2.6, and 4.2...for longs. If the upper stretch is resistance sell it.....or the 1.6 level.....Not much diff...anyways.
Here is an example of the EU today.....which is in an uptrend.
1. Support at the lower stretch for a long time (1st green dashed)...that would be a buy.
2. Movement through the previous close (pink)...good
3. Initial resistance at the 1.61 level (red2)
4. Back for support at the upper stretch (red1)
5. Blast to the 2.618 (red3) level which is now resistance.....but not necessarily a good short because of the uptrend.
Notice the accuracy......even on a visual model.
Hopefully that helps.....It works on everything.
Click image for original size
Emini Day Trading /
Daily Notes /
Forecast /
Economic Events /
Search /
Terms and Conditions /
Disclaimer /
Books /
Online Books /
Site Map /
Contact /
Privacy Policy /
Links /
About /
Day Trading Forum /
Investment Calculators /
Pivot Point Calculator /
Market Profile Generator /
Fibonacci Calculator /
Mailing List /
Advertise Here /
Articles /
Financial Terms /
Brokers /
Software /
Holidays /
Stock Split Calendar /
Mortgage Calculator /
Donate
Copyright © 2004-2023, MyPivots. All rights reserved.
Copyright © 2004-2023, MyPivots. All rights reserved.