ES 6/30/11
Straight up usually stays that way until it doesn't if you think about it.
Maybe some surprising numbers you haven't thought about.
From the April high to the June low the fib levels are;
1280-23.6%
1297-38.2%
1310.50-50%
1324.25-62%
For June range the levels are;
1273.50
1286.50
1297
1307.75
respectively.
I'm currently using two different extensions(when in doubt)and the one previously mentioned has 1309 as the 161.8% level.
Alternatively,the other has 1305, 1310.50, and 1319.50 as the 123,138,and 161% levels.
Personally, I take the 50% levels as the strongest tell. Strength above,and weakness below. Note the levels that match up with others and they too are given a little more weight(ie;1297).
End of quarter really is only displayed in relative performance to peer funds and what looks best in required publishings to investors. I don't know if this lift is corrective or impulsive(5th wave). It doesn't really matter to me,yet.
I will point out it negated a head and shoulders down pattern and took out 6 previous highs on it's way up.
Trade em how you like as that's what it's all about.
three days up increases the odds for the high to low day..( high being put in first then the low)..it didn't happen yesterday and I was wrong but we had some good selling...just not enough and much better buyers......so I am once again selling into the O/N high test at 1307.75...target being 1305......
My recent adition of NYSE VOLD has finally showed some divergence from the ES CD with yesterdays late day rally which is building evidence that the swing high may be near,,,,,the low range of the Overnight session is confirming that struggle to go up from these levels.
Other keys for today are the HV at 1302.50, the low volume at 1300 and then the big one at 1297.50..
I have nothing for the upside but will use 2.5 and 5 points off the On highs if they happen to push that far. Naturally the plus 4- 5.5 and the plus 8 - 10 zones will be important to me especially if I'm expecting the high to low day.
Good luck today..I'm hoping to see you on the downside !!
1307.75 is the Weekly VPOC from the early June selloff week ending 6-3. This current O/N action is showing most volume entering around 1307. So someone is aware of this zone.
Currently sitting on top of 1303.5 which is the September contract RTH high of 6-3 so I'm viewing that as critical support for the bulls today.
Currently sitting on top of 1303.5 which is the September contract RTH high of 6-3 so I'm viewing that as critical support for the bulls today.
Let me also add that the best thing that could happen is if the 9:45 reports runs the market up first today...that will bring about better selling opportunities....Last day of the Month for those who like to know what day it is...LOL!!
I think we are Ok with this as long as that big volume Lorn points out stays that way near the 1307...not adding here in O/N and will manage in the day session only today. Any add ons in day session will be using original entry as the target.
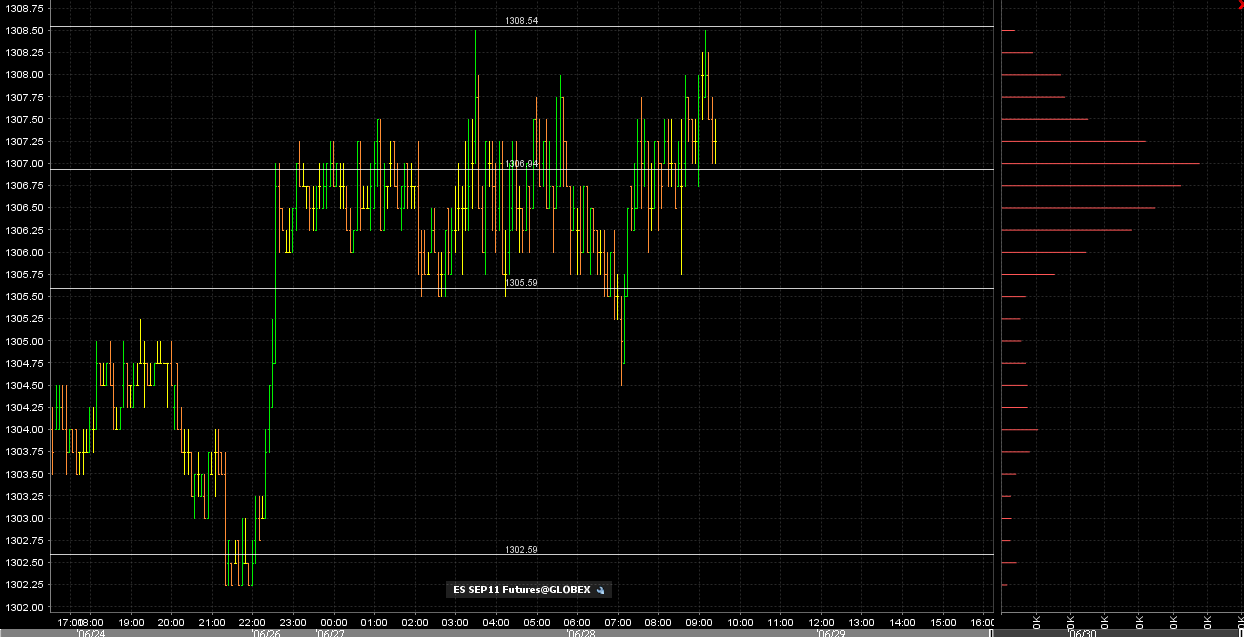
a look at the bell curve distribution I am watching...I have snapped the high and low areas as per the histogram.and the bulk volumein the center.....this will be most important in early trade....my plan as mentioned is to sell higher to mean revert...otherwise I will be covering towards the lower end of this formation into the low volume area
Click image for original size
07 is open print so will add to sells above On high at 09.50 if it prints...that would be break O/N high and be the plus 2.5..otherwise will cover as planned at the 05 area...04.5 is the minus 2.5
that's me done at the line of 05.50...notice how that came just at the run of the 8:30 report reaction low...will wait for report now...hoping for higher trade...they will get a plus or minus 4 - 5.5 and the breakout traders want to be on the correct side of it....Not me...I want to fade it
Plus 2.5 is in at 09.50....!!
short at 1312.25...this is gonna be fun..
someone knew PMI before the release
Bruce - continued success and a happy Holiday weekend to you and the family. Many of us appreciate the sharing. Thanks.
Emini Day Trading /
Daily Notes /
Forecast /
Economic Events /
Search /
Terms and Conditions /
Disclaimer /
Books /
Online Books /
Site Map /
Contact /
Privacy Policy /
Links /
About /
Day Trading Forum /
Investment Calculators /
Pivot Point Calculator /
Market Profile Generator /
Fibonacci Calculator /
Mailing List /
Advertise Here /
Articles /
Financial Terms /
Brokers /
Software /
Holidays /
Stock Split Calendar /
Mortgage Calculator /
Donate
Copyright © 2004-2023, MyPivots. All rights reserved.
Copyright © 2004-2023, MyPivots. All rights reserved.