ES Trading for Mon 7-25-11
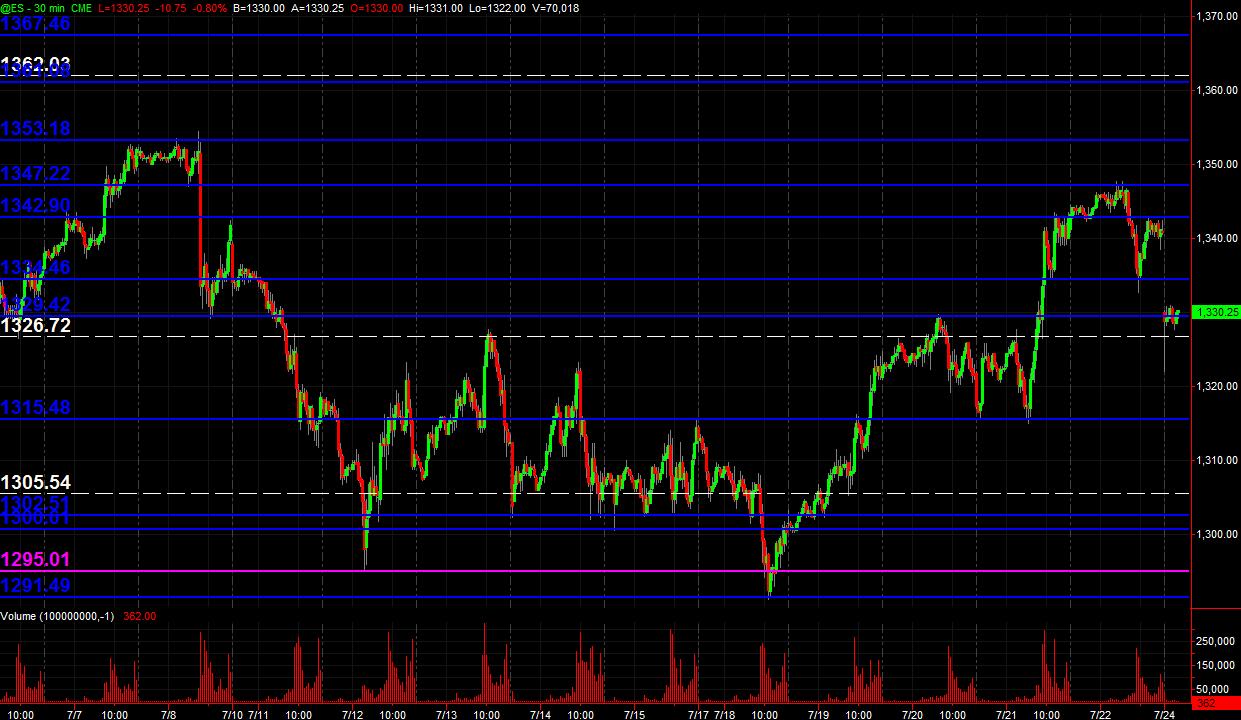
It's 8:30 Central Time that I snapped this pic of my 30min PASR chart (all trading hours) with the Blue lines potential significant "zones" with the White dashed lines as Wkly Pvts. Expected the overnight open to gap down obviously ... and scalped a couple of points long (3 trades - 1 loss, 2 profitable) fwiw ... wanted to just get long and hang on but the price action overnight was scattered ... and am just gonna stand aside until closer to the RTH's. It's my usual "map" ... which may be something less reliable with the s&i+ going on politically in Washington on the debt etc. ... dunno. Anyway, hope some find this helpful coming into the trading day Monday, whether trading the ES or equities!
Also, have some Volume Profile charts of different time frames on the following post.
Click image for original size
Also, have some Volume Profile charts of different time frames on the following post.
32.25 is close enough for me....tricky spot as we approach the 50% mark of the day sown here...best to get out most in front of all that mess
I was using the volume histogram from day session only IB charts Lisa...so when I post and type an area it may not be precise...I need to foucs on the trade and like yourself I'm assuming most will confirm an area with their own charts and work
the 31.75 is the lower extreme of the Low volume...the top is 32.50 as u mentioned
I will not fade the IB high again especially if this low volume area doesn't fill in...better odds to go fil the gap
there was nice $tick divergence on that hour break for reference
the 31.75 is the lower extreme of the Low volume...the top is 32.50 as u mentioned
I will not fade the IB high again especially if this low volume area doesn't fill in...better odds to go fil the gap
there was nice $tick divergence on that hour break for reference
Fridays RTH low is 32.75...longs need that to hold...no coincidence where the low volume formed today
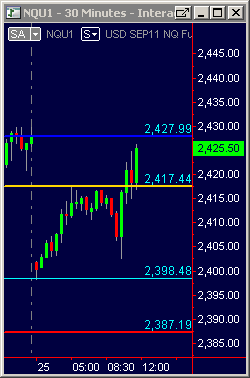
NQ gap is almost closed, watching for reaction. It is also VAL for Friday
Click image for original size
nice wedging up action...one time frame buyers in the market.....I'd like to see some form of an up volume flush to get short for the previous 30 minute bar low retest...it will come but no good signal for that trade yet...best would be to see an air pocket on the 5 minute ...UP !!
Here was my expanded thought process as to why I wasn't trying fades on the second try above the 60 minute high or 90 minute fade today.
1) We opened below the range of Friday and immediately came back into fridays range.
2)WE broke the Overnight high and created a low volume area in todays day session.
3)We tested the Low volume, the O/N high area and the lows of Friday and they all became support !! This is thee critical point as to why I didn't do the 90 minute high fade today.
4) No other 30 minute bar traded through the open print...so buyers entered fairly quick.
still would like to see a volume flush up and an expanded range bar that creates the air pocket to hunt for shorts...preferably after the gap fill..they want to run out the VA low traders so we should tag 40 sometime soon
Nice trade bruce it realy dont get anybetter
The 25 July US equity index rally was driven by the low bond and low 2 yr T-Note yields. Under 0.5 is indicative of confidence, not default. Today's rally was not a technical analysis driven day.
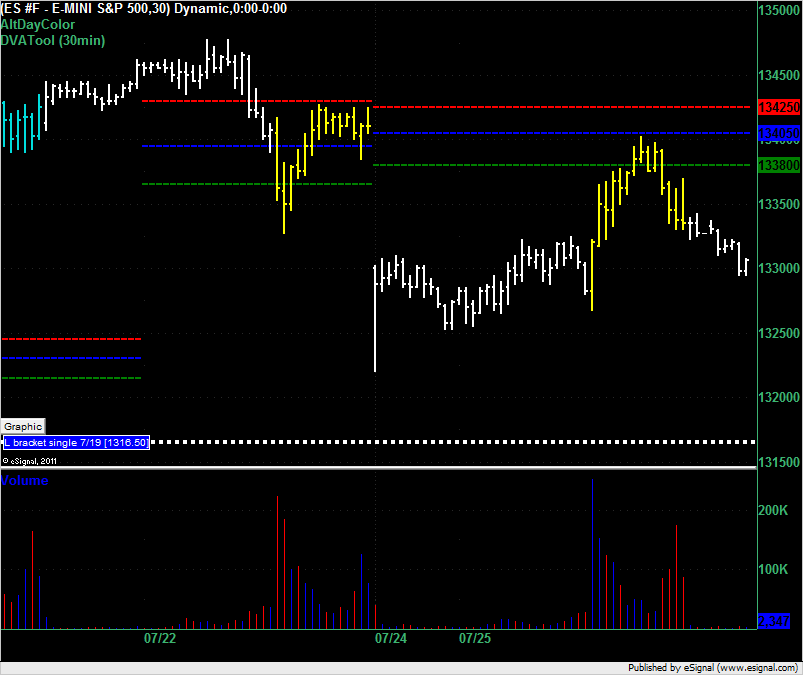
ES high of the day was 1340.25 and the VAL was 1338 even. Had you shorted at the VAL you would have suffered a 2.25 point draw down and a best run up of 5 points to 1333 even. If you work with a 2 point stop then this trade would have been a loser.
Click image for original size
Emini Day Trading /
Daily Notes /
Forecast /
Economic Events /
Search /
Terms and Conditions /
Disclaimer /
Books /
Online Books /
Site Map /
Contact /
Privacy Policy /
Links /
About /
Day Trading Forum /
Investment Calculators /
Pivot Point Calculator /
Market Profile Generator /
Fibonacci Calculator /
Mailing List /
Advertise Here /
Articles /
Financial Terms /
Brokers /
Software /
Holidays /
Stock Split Calendar /
Mortgage Calculator /
Donate
Copyright © 2004-2023, MyPivots. All rights reserved.
Copyright © 2004-2023, MyPivots. All rights reserved.