ES Fri 9-2-11
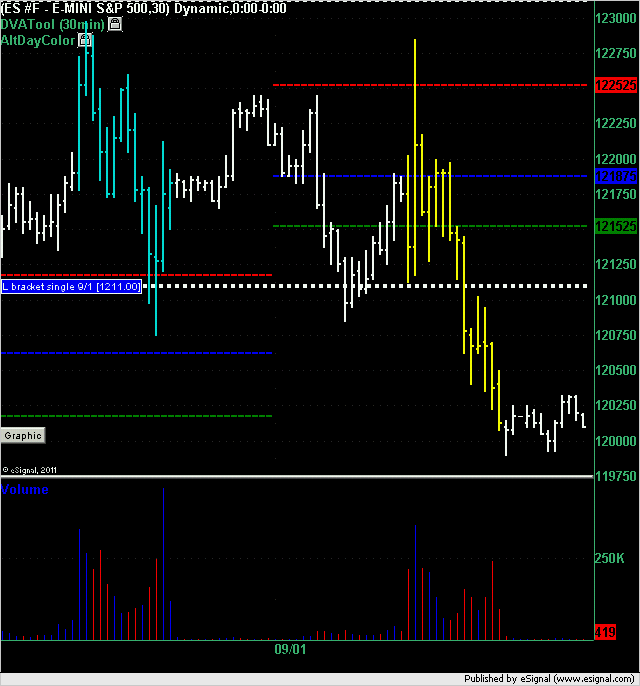
The yellow bars in the chart below are from Thursday trading session. A single print was created in the L bracket at 1211 even. This is a short price for today (Friday's) trading. I suggest a 4 point stop.
Click image for original size
Click image for original size
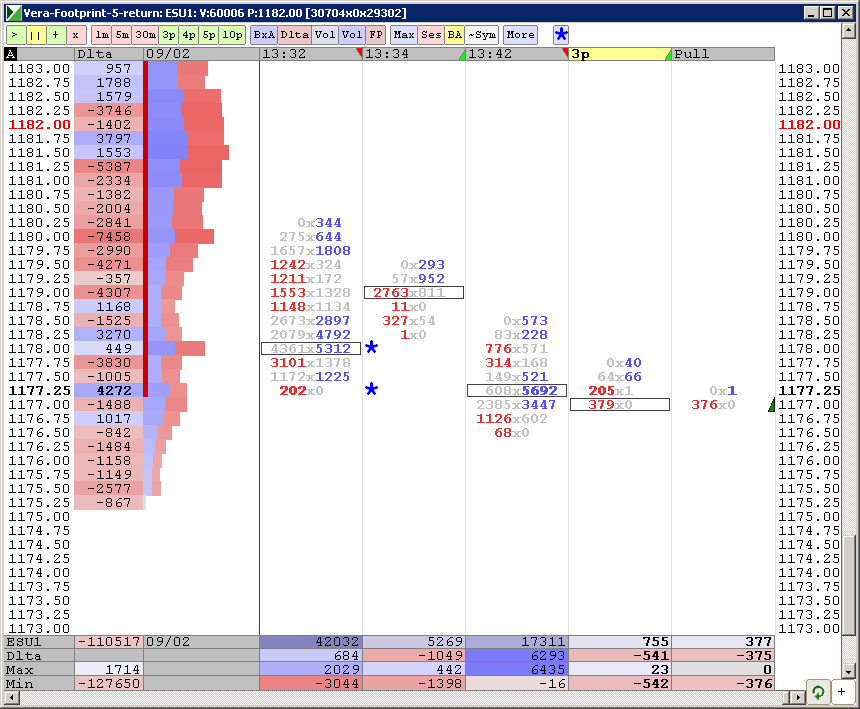
I have VPOC at 1173.75
just noticed, NQ has not closed the old gap yet. Close on my charts is 21,165.5. High of that day was 21,169
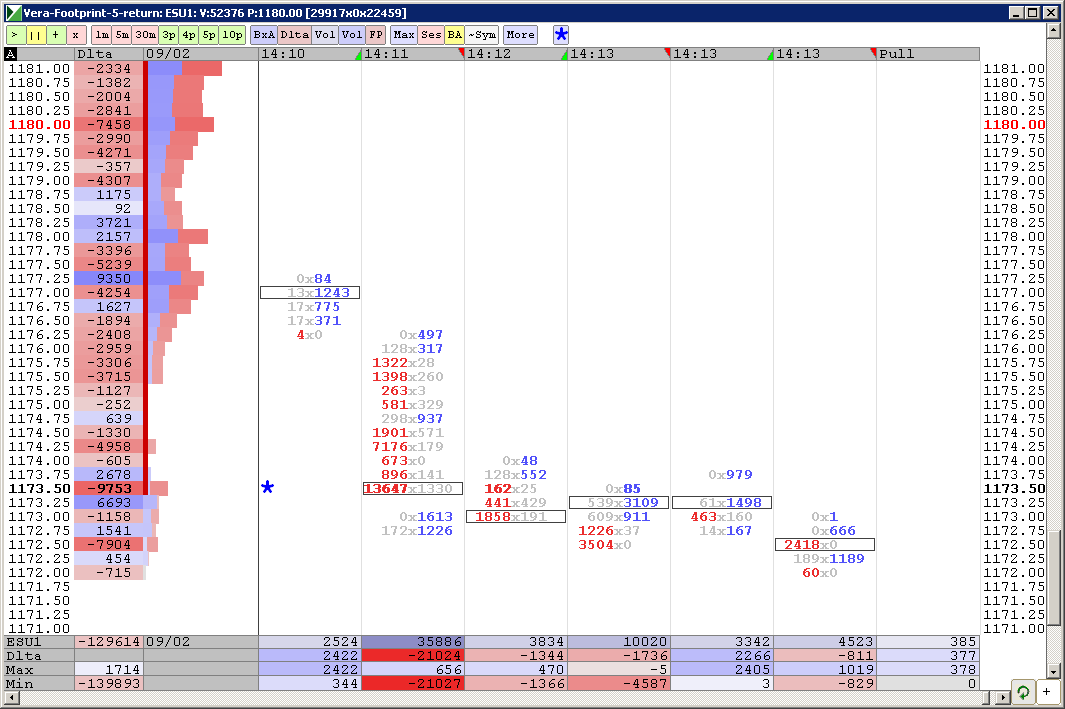
First volumme above 10K
Click image for original size
I missedit, stepped away for a bite
Well it makes me a bit sad that only one person could actually take the time to respond to my question on Friday. I like to think that I've helped a few of you out with ideas over time here on the froum and in private emails. So this is a bit disturbing that nobody could take the time to set me straight. It turns out that there actually is a big gap in the data from that 8:30 report.
Originally posted by BruceM
2184 - 2180 is key NQ zone...overnight hitting into zones perfectly..
anyone else have a big gap in ES data at 98.75 ??
11300 - 11316 is key YM zone...!
Emini Day Trading /
Daily Notes /
Forecast /
Economic Events /
Search /
Terms and Conditions /
Disclaimer /
Books /
Online Books /
Site Map /
Contact /
Privacy Policy /
Links /
About /
Day Trading Forum /
Investment Calculators /
Pivot Point Calculator /
Market Profile Generator /
Fibonacci Calculator /
Mailing List /
Advertise Here /
Articles /
Financial Terms /
Brokers /
Software /
Holidays /
Stock Split Calendar /
Mortgage Calculator /
Donate
Copyright © 2004-2023, MyPivots. All rights reserved.
Copyright © 2004-2023, MyPivots. All rights reserved.