ES Tue 9-6-11
The chart below is from Friday's trading session. The market created a single print in the M bracket at 1175 even and then triggered a short in the last 45 minutes of the day at that price. The market rose to 1176.75 for 1.75 point draw down and then ran up to a best possible profit of 8.25 points at the low of the day 1168.50.
Anybody not trading that single print could be forgiven because it was so late into the day going into the Labor Day holiday weekend.
Anybody not trading that single print could be forgiven because it was so late into the day going into the Labor Day holiday weekend.
Click image for original size
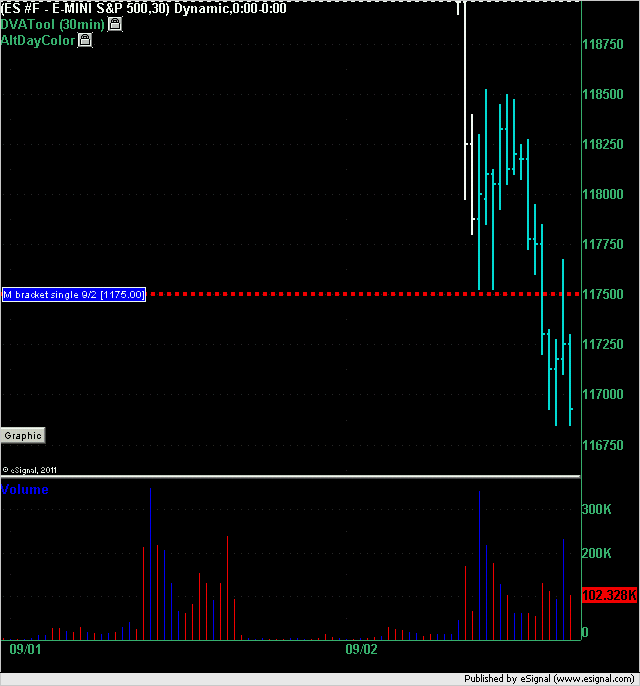
Per ACD system. Trade was to short at 1175 area with stop loss at 1184. 9 points stop loss is too much for me. So, i use 2 points stop loss. In my experience ( which is mainly trading crude oil futures)when A down trend or uptrend is for REAL, prices rarely go much beyond OR reference point in particular if daily pivot and 3 day rolling pivots are close by to act as RESISTANCE.
Per MF, an A down or A up alone gives a trader 3% edge , however combined with daily pivot, shrinking pivot range and 3 day rolling pivot combined with an A up or A down increase the edge to 8-10%. Not sure how he came up with these percentages.
Looks like by clicking on the link , chart shows up, so no need to copy in a browser.
A few weeks ago I commented on how helpful it was to watch for the initial impulse price action after major news events to get an indication of where the market would want to take price. Using Kools Tools for price, the initial move on the ES (before a decent retrace) after the unemployment report was 1198.5-1179.75 giving an initial projection of 1168.25. That came into play on Friday during the pit session. That move gave a full projection of 1149.5 which was taken out during today's Globex. Once 1149.5 was taken out it was beneficial to look for the next level before another decent retrace (from that initial level) which was 1175.25. 1198.5-1175.25 gave a full projection of 1137.5 which was just taken out (it over-ran to 1136.25 but on a move of 60+ points got pretty close).
Kools Tools tend to work well with all instruments I work with. For example, the initial post unemployment report move on crude oil was 88.20-86.31. That gave a full projection of 83.25. Crude hit 83.20 within an hour of the open of this evening's Globex session and has since rebounded 80 cents ($800 a contract).
It is phenomenal how often these projections are fulfilled.
Thanks prestwickdrive for sharing. After reading your post, i looked into kool blue posts to get an understanding of these tools. Following is a note from one of kool blue posts. Looks like he is a scalper. My question to you is " Are you a scalper? or you use kool tolls to get maximum gains out of projected price levels".
" Predicting a turning point is frankly, not that difficult, but knowing if that turn will be 5 ticks or 500 is. That's why I'm a scalper . All I really care about is the next few minutes. Any way remember I commented on the cycles thread that I knew by around 10:15 that the market 'wanted' 984? Here's how that came about. Remember, the theory is that every initial move times 1.618 and added to the end of that initial thrust gives the point at which it will run out of gas so to speak."
" Predicting a turning point is frankly, not that difficult, but knowing if that turn will be 5 ticks or 500 is. That's why I'm a scalper . All I really care about is the next few minutes. Any way remember I commented on the cycles thread that I knew by around 10:15 that the market 'wanted' 984? Here's how that came about. Remember, the theory is that every initial move times 1.618 and added to the end of that initial thrust gives the point at which it will run out of gas so to speak."
Deutsche Bank CEO gave a terrifying speech in Frankfurt
http://www.businessinsider.com/josef-ackermann-euro-banks-speech-frankfurt-2011-9#ixzz1X76elvHS
Asian markets falling some 2.5 percent followed by a 5 percent drop in European markets
http://www.businessinsider.com/josef-ackermann-euro-banks-speech-frankfurt-2011-9#ixzz1X76elvHS
Asian markets falling some 2.5 percent followed by a 5 percent drop in European markets
struggle
Click image for original size
Click image for original size
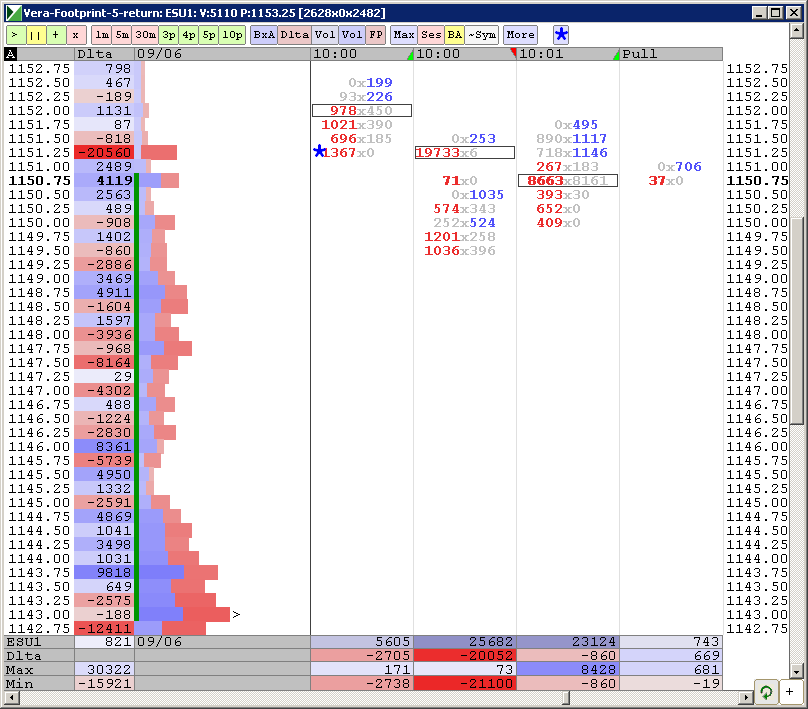
so there was a residual order at 51.25
1151.50 and 1148 are 50% levels for ES to me, strength above,weakness below
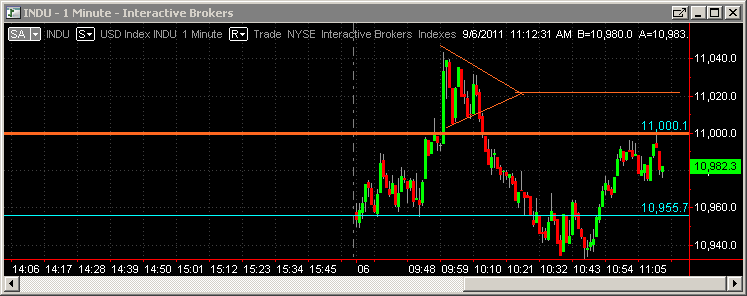
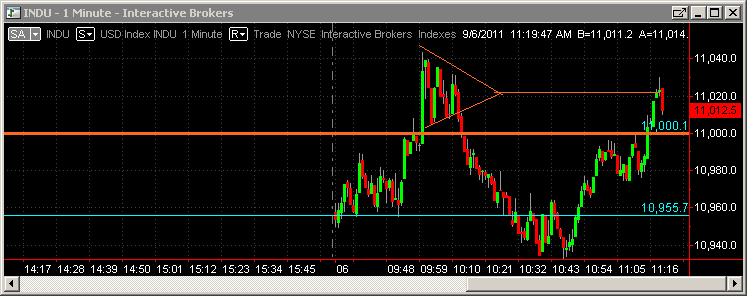
DJI approx 1000 pt range 10650-11650 gives 11150-50% and 11032-62%
10650 50% of 14200-7100 range
DJI approx 1000 pt range 10650-11650 gives 11150-50% and 11032-62%
10650 50% of 14200-7100 range
if market takes this level out, we will have "rocket fuel"
Originally posted by destiny
Thanks prestwickdrive for sharing. After reading your post, i looked into kool blue posts to get an understanding of these tools. Following is a note from one of kool blue posts. Looks like he is a scalper. My question to you is " Are you a scalper? or you use kool tolls to get maximum gains out of projected price levels".
" Predicting a turning point is frankly, not that difficult, but knowing if that turn will be 5 ticks or 500 is. That's why I'm a scalper . All I really care about is the next few minutes. Any way remember I commented on the cycles thread that I knew by around 10:15 that the market 'wanted' 984? Here's how that came about. Remember, the theory is that every initial move times 1.618 and added to the end of that initial thrust gives the point at which it will run out of gas so to speak."
Sorry for the delay in responding. I have been on the road and just saw your question. I scalp also and use the KT projectons as an aid for trade placement. If I could master better stop discipline I believe I could generate more trading profits by believing the KT projections and riding them for much more than a scalp. Perhaps someday ... :-)
Emini Day Trading /
Daily Notes /
Forecast /
Economic Events /
Search /
Terms and Conditions /
Disclaimer /
Books /
Online Books /
Site Map /
Contact /
Privacy Policy /
Links /
About /
Day Trading Forum /
Investment Calculators /
Pivot Point Calculator /
Market Profile Generator /
Fibonacci Calculator /
Mailing List /
Advertise Here /
Articles /
Financial Terms /
Brokers /
Software /
Holidays /
Stock Split Calendar /
Mortgage Calculator /
Donate
Copyright © 2004-2023, MyPivots. All rights reserved.
Copyright © 2004-2023, MyPivots. All rights reserved.