ES Wednesday 9-22-11
Key numbers
76 - 77 is key sells zone then above O/N high near 82 but that is high volume
71 - 72
66-67
61 - 62...key support
55
50.50
big support 44.5- 45.50
I prefer sells on any rally up early on
76 - 77 is key sells zone then above O/N high near 82 but that is high volume
71 - 72
66-67
61 - 62...key support
55
50.50
big support 44.5- 45.50
I prefer sells on any rally up early on
Bruce,
Although I don't use it much, I have received training in TS.. Don't mind sharing it with you, just contact me..
TZ
Although I don't use it much, I have received training in TS.. Don't mind sharing it with you, just contact me..
TZ
low vol area 61 to 62
Great forecast for the day, Bruce!
Originally posted by BruceM
Key numbers
76 - 77 is key sells zone then above O/N high near 82 but that is high volume
71 - 72
66-67
61 - 62...key support
55
50.50
big support 44.5- 45.50
I prefer sells on any rally up early on
Originally posted by sandoxe
Nice numbers BM.
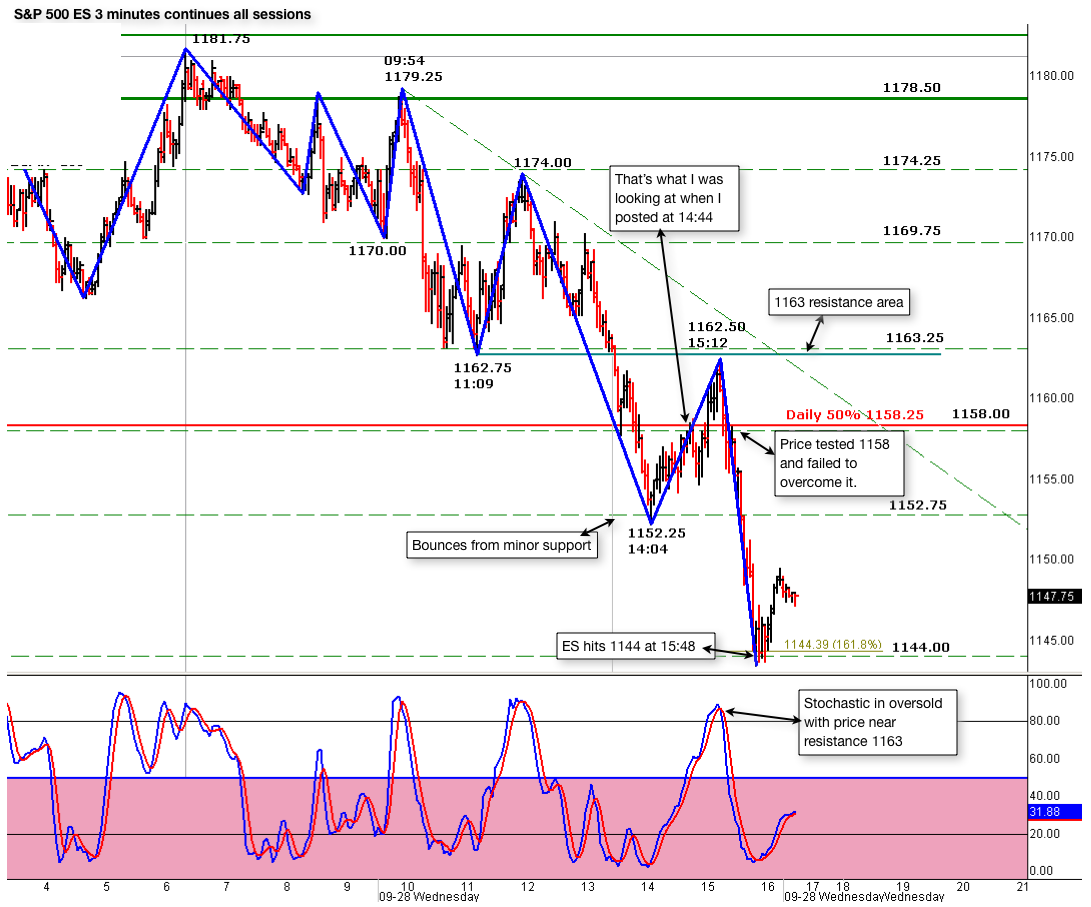
1158 is important today for the ES bc it's 50% on the daily. ES hit the minor support area 1152.25 and bounced from there. Now it's testing 1158. Failure here indicates that 1144 is the next objective and possibly lower.
Projected time late eve.
Moving above 1163 will void the above.
ES is now trading 1158 @ 14:44
No need to wait till late eve. ES hit 1144.00 at 15:48 and currently testing as support. (Quick 14 pts move)
ES now trading 1144.50 at 16:01 E.T.
ES now trading
Originally posted by sandoxe
Originally posted by sandoxe
Nice numbers BM.
1158 is important today for the ES bc it's 50% on the daily. ES hit the minor support area 1152.25 and bounced from there. Now it's testing 1158. Failure here indicates that 1144 is the next objective and possibly lower.
Projected time late eve.
Moving above 1163 will void the above.
ES is now trading 1158 @ 14:44
No need to wait till late eve. ES hit 1144.00 at 15:48 and currently testing as support. (Quick 14 pts move)
ES now trading 1144.50 at 16:01 E.T.
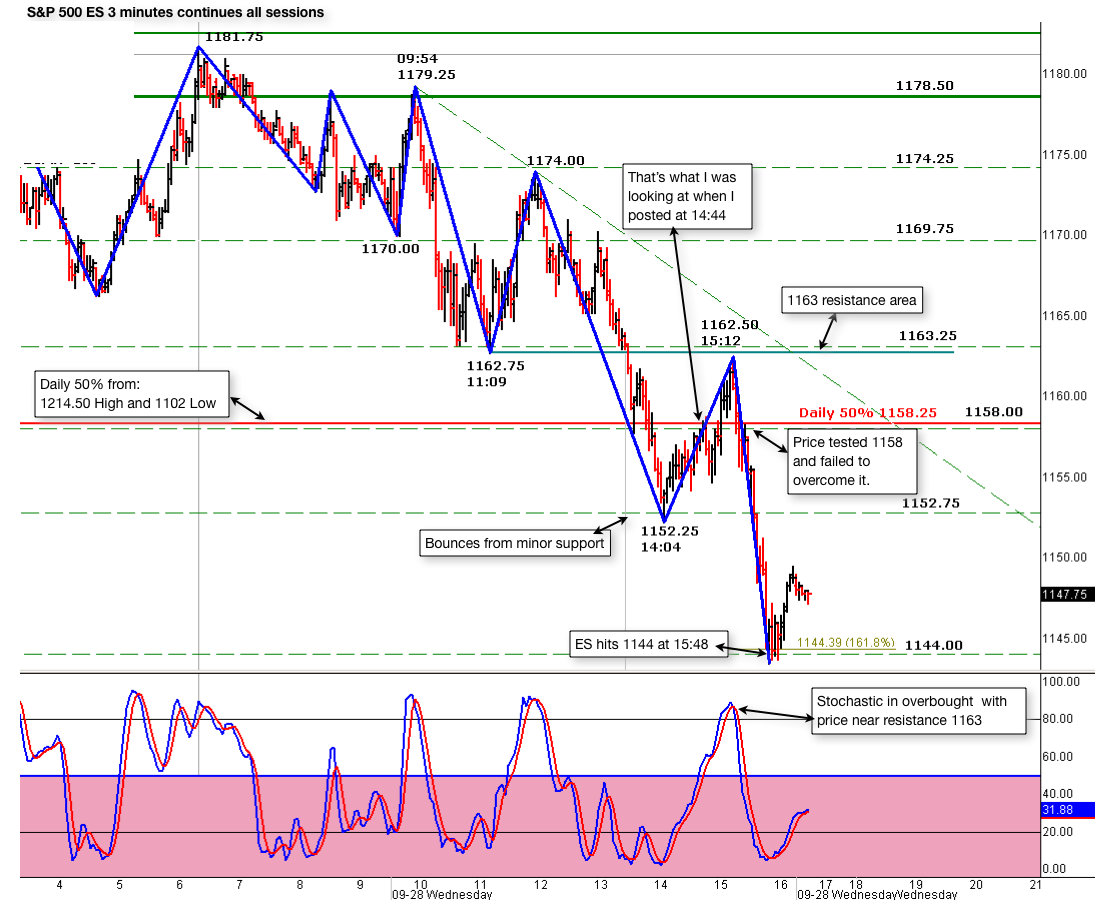
Here's a 3 minutes chart showing the different r/s for today and the daily 50% line. Notice where the price was at 14:44. The price did try to get up and away from 1158 but failed to even touch the 1163 resistance area. Then again, at 1158 the price failed to move back up and above it. Bearish, bearish.
I hope this helps in some way
Click image for original size
Originally posted by sandoxe
Originally posted by sandoxe
[quote]Originally posted by sandoxe
Nice numbers BM.
1158 is important today for the ES bc it's 50% on the daily. ES hit the minor support area 1152.25 and bounced from there. Now it's testing 1158. Failure here indicates that 1144 is the next objective and possibly lower.
Projected time late eve.
Moving above 1163 will void the above.
ES is now trading 1158 @ 14:44
No need to wait till late eve. ES hit 1144.00 at 15:48 and currently testing as support. (Quick 14 pts move)
ES now trading 1144.50 at 16:01 E.T.
ere's a 3 minutes chart showing the different r/s for today and the daily 50% line. Notice where the price was at 14:44. The price did try to get up and away from 1158 but failed to even touch the 1163 resistance area. Then again, at 1158 the price failed to move back up and above it. Bearish, bearish.
I hope this helps in some way
Click image for original size
Emini Day Trading /
Daily Notes /
Forecast /
Economic Events /
Search /
Terms and Conditions /
Disclaimer /
Books /
Online Books /
Site Map /
Contact /
Privacy Policy /
Links /
About /
Day Trading Forum /
Investment Calculators /
Pivot Point Calculator /
Market Profile Generator /
Fibonacci Calculator /
Mailing List /
Advertise Here /
Articles /
Financial Terms /
Brokers /
Software /
Holidays /
Stock Split Calendar /
Mortgage Calculator /
Donate
Copyright © 2004-2023, MyPivots. All rights reserved.
Copyright © 2004-2023, MyPivots. All rights reserved.