ES Wednesday 9-22-11
Key numbers
76 - 77 is key sells zone then above O/N high near 82 but that is high volume
71 - 72
66-67
61 - 62...key support
55
50.50
big support 44.5- 45.50
I prefer sells on any rally up early on
76 - 77 is key sells zone then above O/N high near 82 but that is high volume
71 - 72
66-67
61 - 62...key support
55
50.50
big support 44.5- 45.50
I prefer sells on any rally up early on
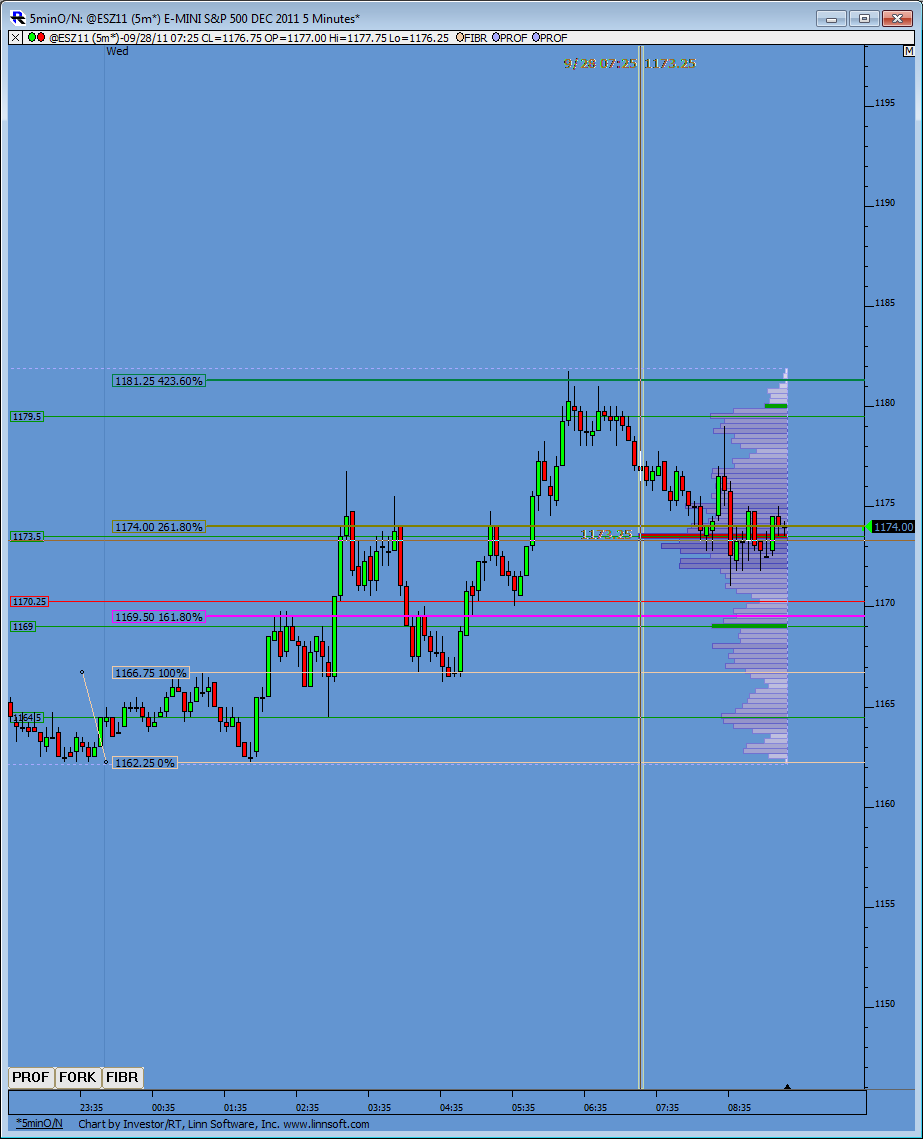
Morning people. Attached is the O/N volume profile to this point. Also a projection up from the O/N low. Prices hit the 4.236 number and reversed.
Something else to note. The 1181.75 O/N high is just three ticks higher then yesterday's O/N high.
Low volume marked by the red line at 1170.25 in the middle of the profile. As I study it the 1166 number jumps out at me as key support in the O/N as it also sports low volume and this is where price reversed higher after coming back from the 2.618 zone of 1174.
Something else to note. Within the gap between YD's Low and Monday's High there is some LVN's specifically at 1162.25 area. This is where prices reversed in the O/N and incidentally, is also where the 600 period MA sits on a 5 min RTH chart.
Gap to 1159 and then down to 1155 look like important support for those who wish to be bull's. If there is to be a breakdown this area is the place to watch for confirmation.
Make sure you keep an eye on what the USD/EUR is doing. Equities and USD seem to be pegged together right. If USD is strengthening, equities are weakening and the opposite. I'm not sure which one is leading but its been helpful to watch the USD S/R levels for additional confirmation of ES moves.
Click image for original size
key prices up here with an air pocket below....trying shorts in the 77 area
short 77.75...ultimate target is 74.25...
hows the foot prints doing up here?

Della, I missed 1177.70 large print, so I do not know if it came before or after the volume shown above it.
Click image for original size
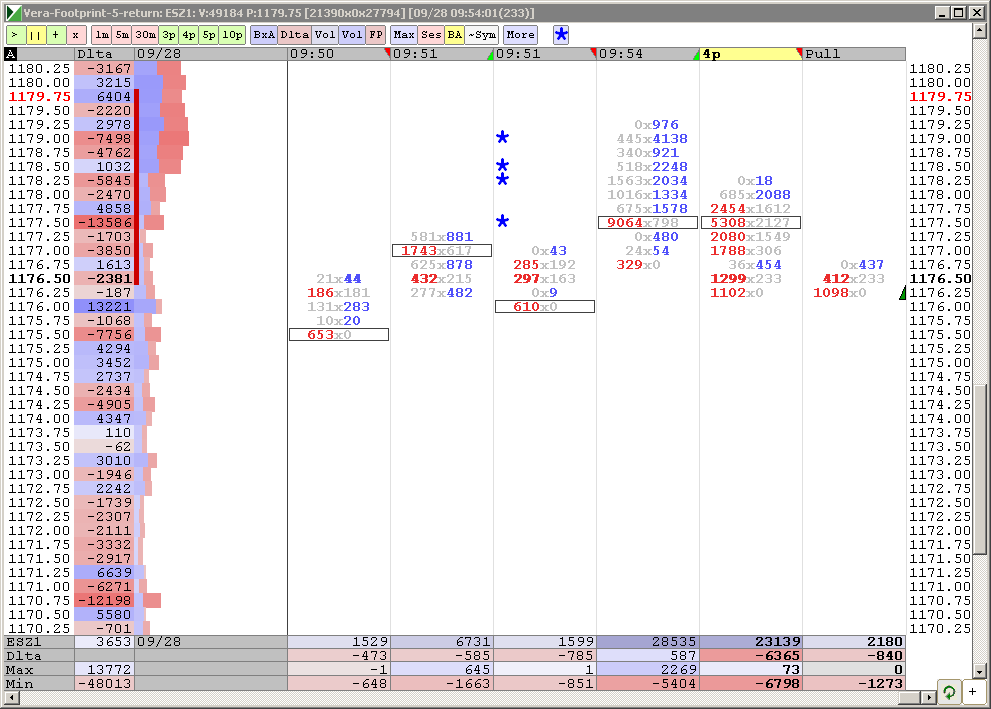
moving target up a tic to 74.50 as low volume is at 74.25
let's not forget where the low volume was from yesterdays RTH session.....76 - 77...we can't place too much on the Overnight especially when Overnight falls inside the range of the previous day.. but definately factor it in to your zones ...trying to exit last contract at 72 even but think we may pop back up a bit to mess with 74.25 a bit
looking for longs in the 66 - 67 zone...air pocket above but we need a signal...
long 65.25 and light...low volume up above 68.75
Originally posted by sandoxe
Originally posted by sandoxe
[quote]Originally posted by sandoxe
Nice numbers BM.
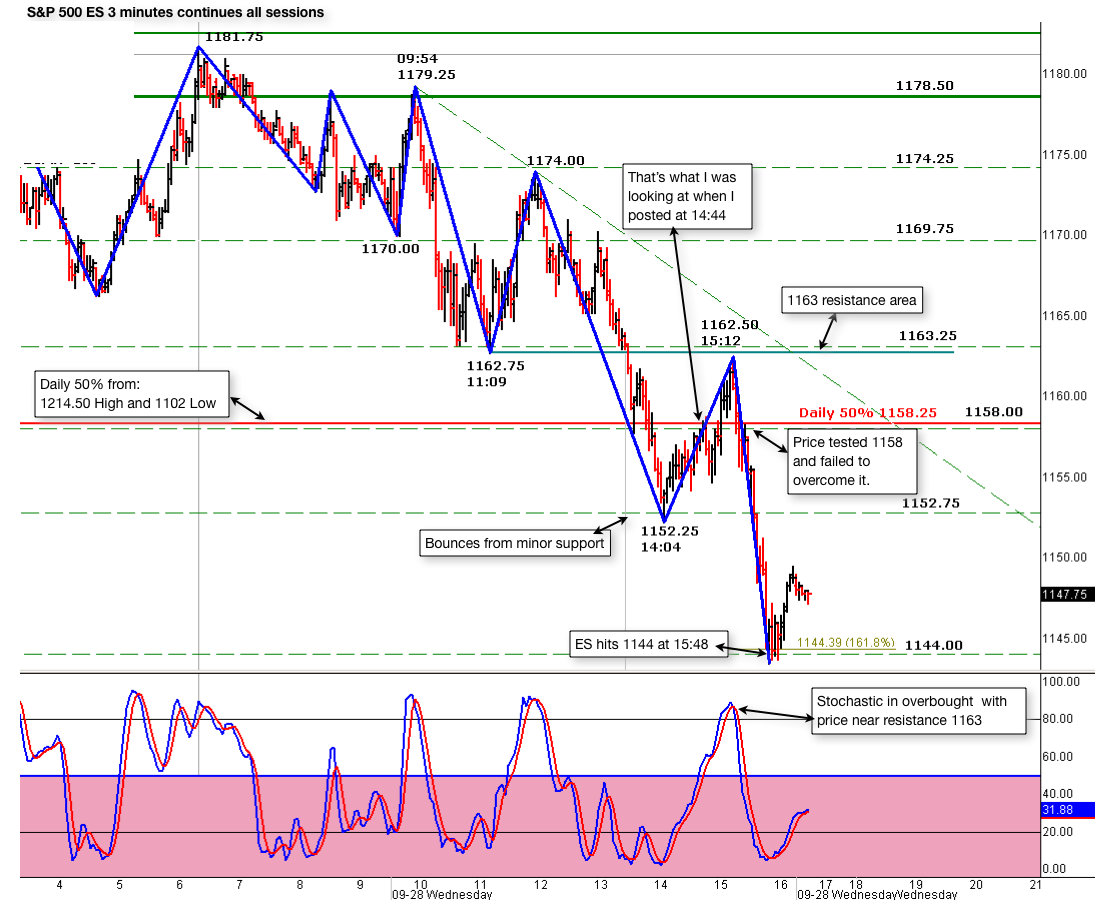
1158 is important today for the ES bc it's 50% on the daily. ES hit the minor support area 1152.25 and bounced from there. Now it's testing 1158. Failure here indicates that 1144 is the next objective and possibly lower.
Projected time late eve.
Moving above 1163 will void the above.
ES is now trading 1158 @ 14:44
No need to wait till late eve. ES hit 1144.00 at 15:48 and currently testing as support. (Quick 14 pts move)
ES now trading 1144.50 at 16:01 E.T.
ere's a 3 minutes chart showing the different r/s for today and the daily 50% line. Notice where the price was at 14:44. The price did try to get up and away from 1158 but failed to even touch the 1163 resistance area. Then again, at 1158 the price failed to move back up and above it. Bearish, bearish.
I hope this helps in some way
Click image for original size
Emini Day Trading /
Daily Notes /
Forecast /
Economic Events /
Search /
Terms and Conditions /
Disclaimer /
Books /
Online Books /
Site Map /
Contact /
Privacy Policy /
Links /
About /
Day Trading Forum /
Investment Calculators /
Pivot Point Calculator /
Market Profile Generator /
Fibonacci Calculator /
Mailing List /
Advertise Here /
Articles /
Financial Terms /
Brokers /
Software /
Holidays /
Stock Split Calendar /
Mortgage Calculator /
Donate
Copyright © 2004-2023, MyPivots. All rights reserved.
Copyright © 2004-2023, MyPivots. All rights reserved.