ES Wednesday 9-22-11
Key numbers
76 - 77 is key sells zone then above O/N high near 82 but that is high volume
71 - 72
66-67
61 - 62...key support
55
50.50
big support 44.5- 45.50
I prefer sells on any rally up early on
76 - 77 is key sells zone then above O/N high near 82 but that is high volume
71 - 72
66-67
61 - 62...key support
55
50.50
big support 44.5- 45.50
I prefer sells on any rally up early on
covering all but one at 67.50...last target is 68.50 .....
Flat now...most likely done for today
welcome back Lorn..nice to "see" ya...
bruce whenever you have a moment could you show me what type of signal you look for when price reaches one of your zones
thanks (and sorry if you have answered this already in the past)
thanks (and sorry if you have answered this already in the past)
welcome back lorn its been a long time
Thanks for the welcomes guys. Cheers.
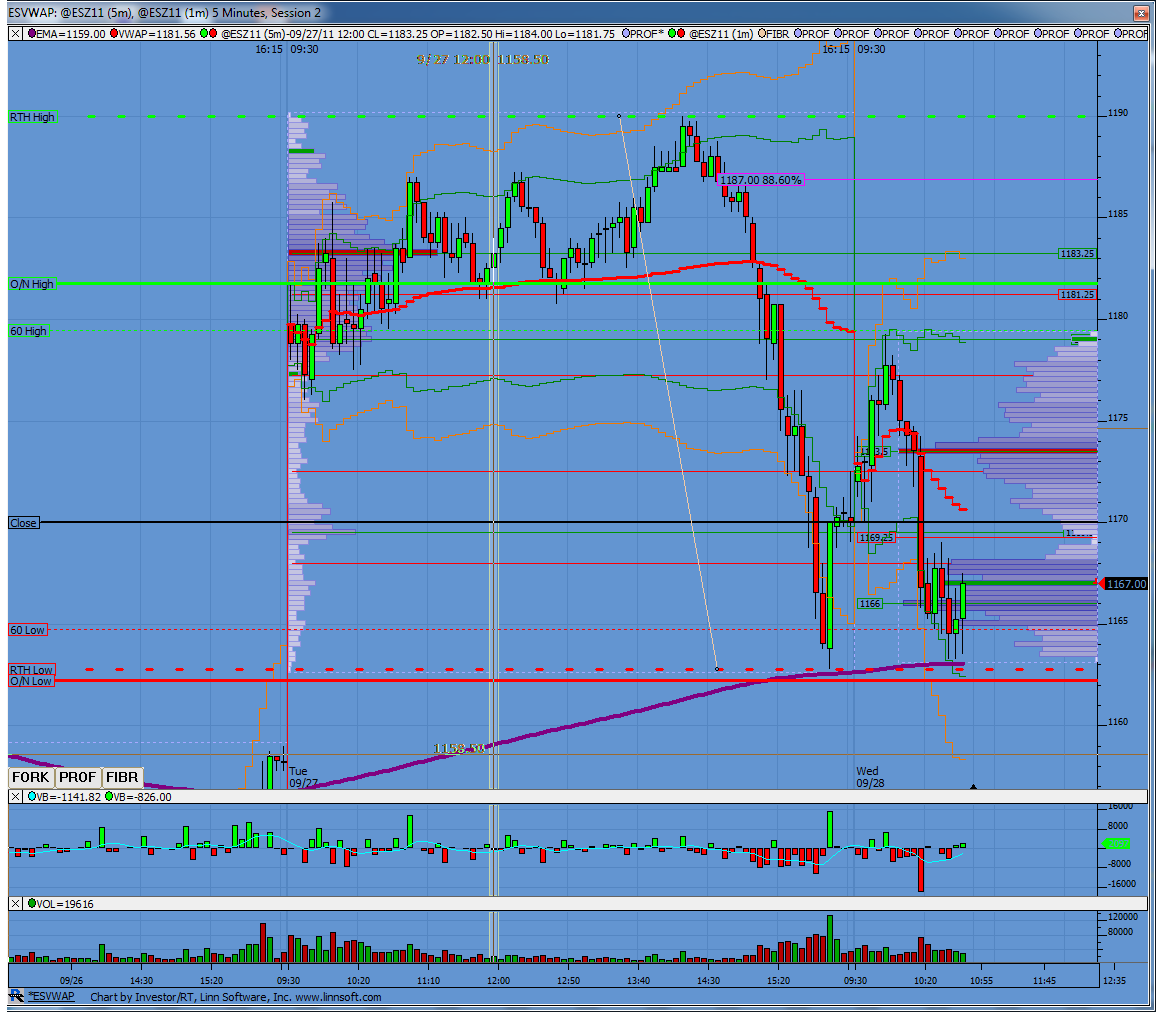
Nice look at the action so far today. Yesterday's profile on the left, todays developing profile on the right. LVN's marked by red lines. That 1169.25 LVN marks a single print on the MP chart. This is resistance for this current consolidation going on here at YD's lows.
Nice look at the action so far today. Yesterday's profile on the left, todays developing profile on the right. LVN's marked by red lines. That 1169.25 LVN marks a single print on the MP chart. This is resistance for this current consolidation going on here at YD's lows.
Click image for original size
APK...I did an office reorganization a few weeks ago so now it is a real hassle to post my Market Delta charts....But I am using the footprints with a .50 renko and I am getting better and anticipating turns and flips in the delta volume at the key price zones....
Often I will take two and sometimes three stabs at a price zone with a tighter stop.....so even though you will see what I post here as a trade entry I sometimes am on my second or third try at the entry... before I get a trade to "stick"
today is a good example as I originaly had a 76.50 short that went nowhere fast so I exited at 76.75....and didn't cover anything fast enough...then I got another signal up at 77.75 which played out well..
I usually get stopped out very fast on the ones that don't work so those don't ever get posted to the forum...This should address anyones concern that may think I don't have losses...I most certainly do.....The 65 area long worked right away and only took one try....
I'm also looking to research the time and sales strip so if anyone has any good resources for me then I'd appreciate it...many remember I use to average in...well I rarely do that any more and if I do it is with much smaller size...hope that helps a bit...it is the anticipation of the delta flips
thanks, appreciate it
Originally posted by BruceM
welcome back Lorn..nice to "see" ya...
Ditto - great to see you again!
Nice numbers BM.
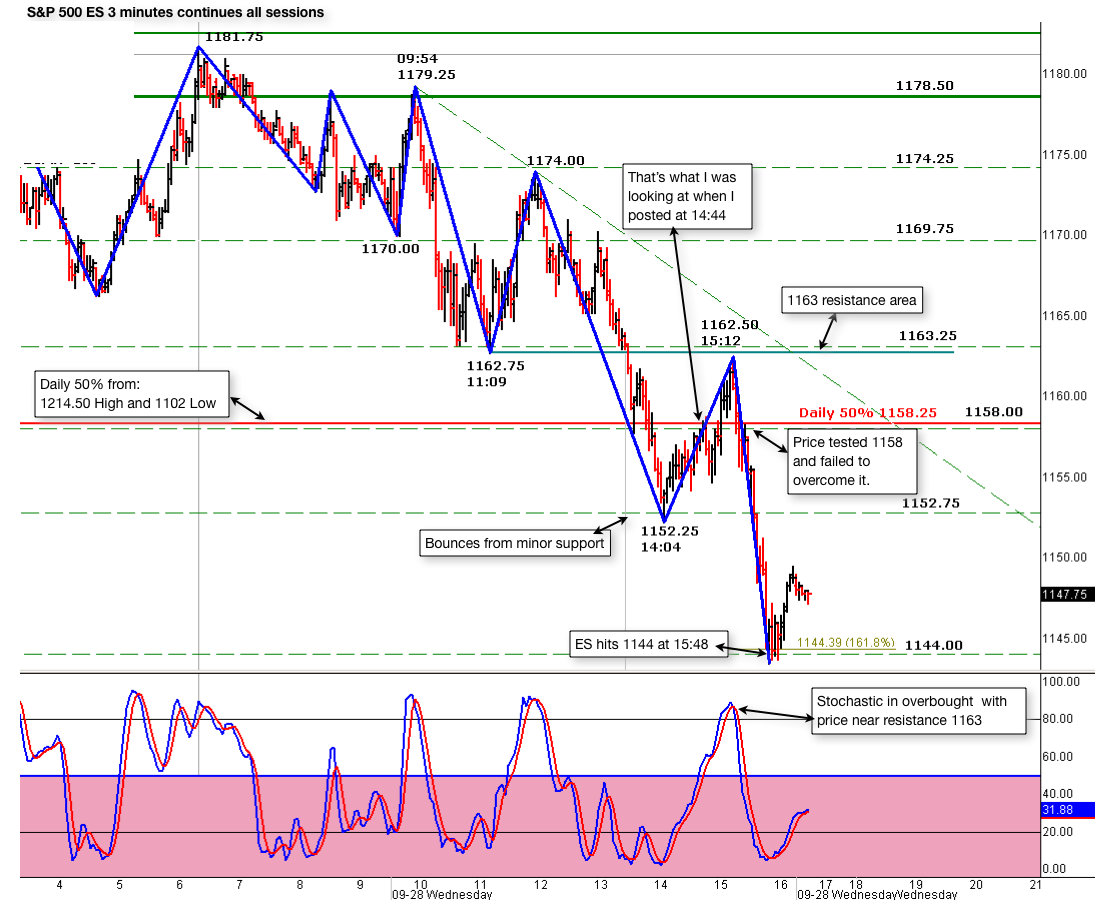
1158 is important today for the ES bc it's 50% on the daily. ES hit the minor support area 1152.25 and bounced from there. Now it's testing 1158. Failure here indicates that 1144 is the next objective and possibly lower.
Projected time late eve.
Moving above 1163 will void the above.
ES is now trading 1158 @ 14:44
Originally posted by sandoxe
Originally posted by sandoxe
[quote]Originally posted by sandoxe
Nice numbers BM.
1158 is important today for the ES bc it's 50% on the daily. ES hit the minor support area 1152.25 and bounced from there. Now it's testing 1158. Failure here indicates that 1144 is the next objective and possibly lower.
Projected time late eve.
Moving above 1163 will void the above.
ES is now trading 1158 @ 14:44
No need to wait till late eve. ES hit 1144.00 at 15:48 and currently testing as support. (Quick 14 pts move)
ES now trading 1144.50 at 16:01 E.T.
ere's a 3 minutes chart showing the different r/s for today and the daily 50% line. Notice where the price was at 14:44. The price did try to get up and away from 1158 but failed to even touch the 1163 resistance area. Then again, at 1158 the price failed to move back up and above it. Bearish, bearish.
I hope this helps in some way
Click image for original size
Emini Day Trading /
Daily Notes /
Forecast /
Economic Events /
Search /
Terms and Conditions /
Disclaimer /
Books /
Online Books /
Site Map /
Contact /
Privacy Policy /
Links /
About /
Day Trading Forum /
Investment Calculators /
Pivot Point Calculator /
Market Profile Generator /
Fibonacci Calculator /
Mailing List /
Advertise Here /
Articles /
Financial Terms /
Brokers /
Software /
Holidays /
Stock Split Calendar /
Mortgage Calculator /
Donate
Copyright © 2004-2023, MyPivots. All rights reserved.
Copyright © 2004-2023, MyPivots. All rights reserved.