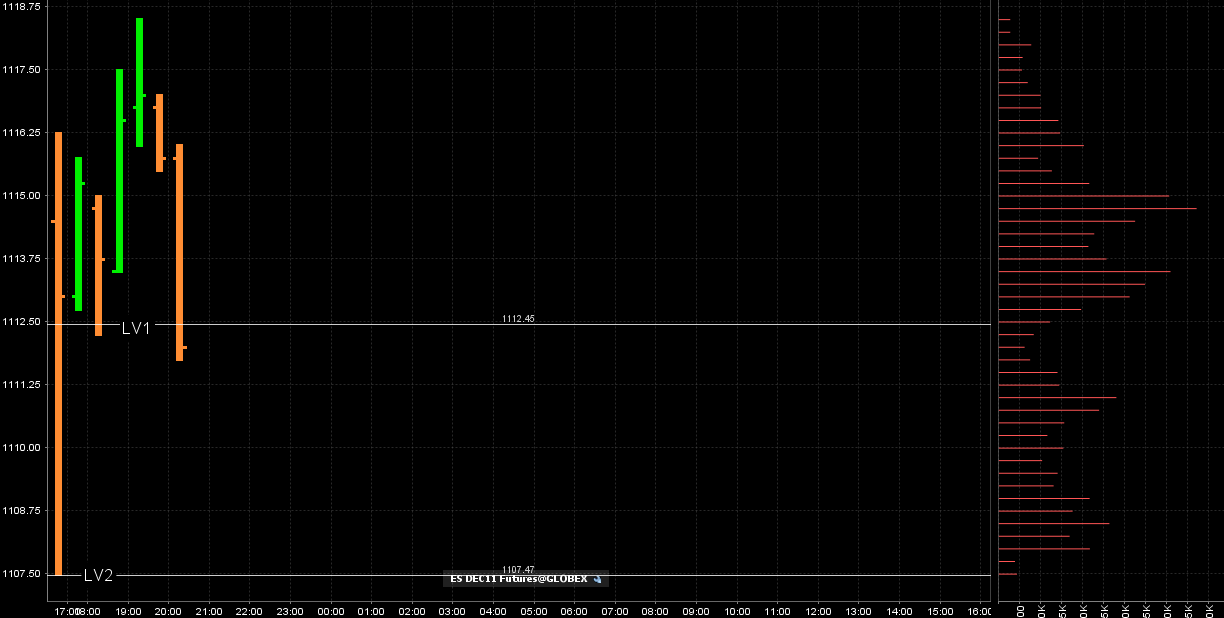
ES Wednesday 10-5-11
Very interesting finish today which hopefuly will helps us expand our knowledge of the bell curves. At the end of today we blew right through the high volume node of 1102.75 and then preceeded to blow through the low volume nodes ( LV1 and LV2 zones from yesterdays chart) that comprised the 1107.5- 1112.50 area. The market then stoped at our high volume area of 1120.
The rules as I have stated them say that we will come back to test LOW volume and that is why I choose to be more agressive in the low volume zones. They donot state that we will retest high volume and that is why I donot trade at those areas for retests once broken. Like all trading methods this has it's losses and trading at the end of the day is more prone to trend then in the morning. So if you were trading this afternoon it would have been most challenging but here is the interesting part. As soon as the Overnight opened the market dropped like a rock to come back down to test all the way down to our 1107.50 and retest the entire zone...like it should.
here is how the overnight looks as I type...the point of all this babble is that we can count on Low volume being tested but not so much the high volume nodes once broken.
Click image for original size
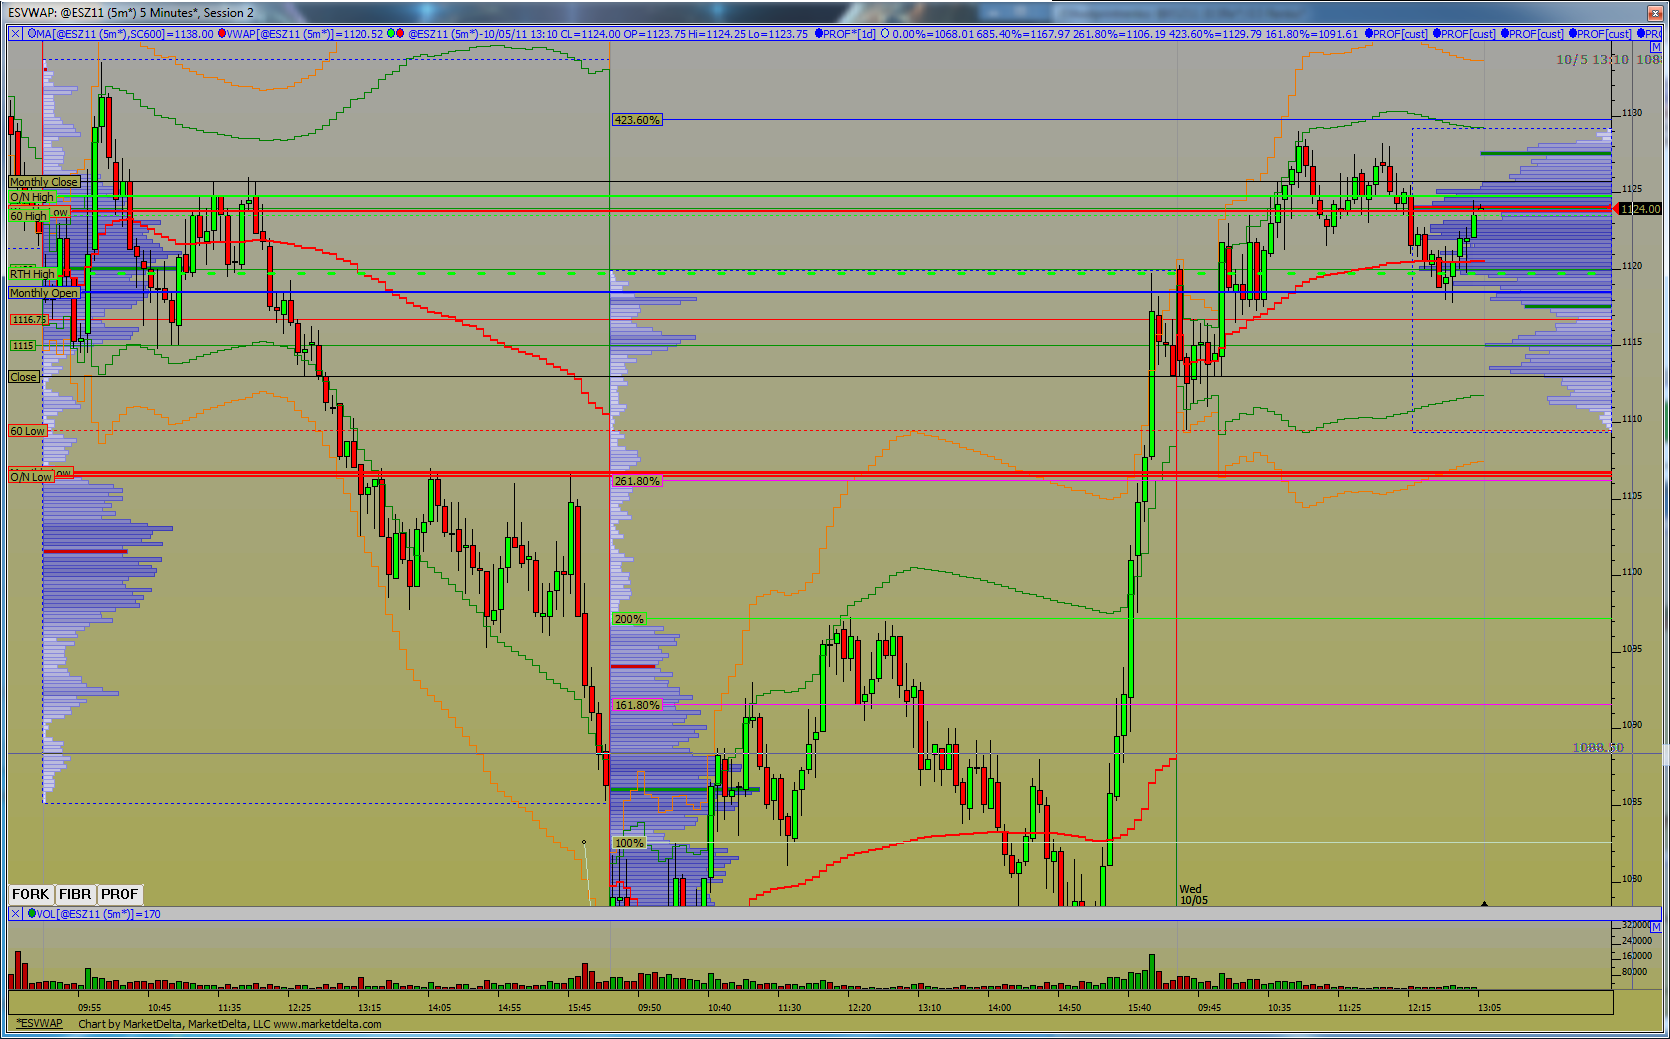
Midday update.
So far, typical MATD action. As Bruce has pointed out and you can see on the chart, a LVN sits at 16.75 which is just below the Monthly Open.
Prices could march higher from here but a better point to attempt a long would be from the 60 min lows down into that 1106 LVN, which is the O/N low, last weeks low, as well as Monday's resistance point for the sell off in the afternoon.
Developing profile on the right and prior day profiles on the left. You can see all the volume zones/thresholds which establish support/resistance.
Remember the old addage, what was once support can become resistance, and the other way around.
If prices do break higher before back filling, then, as Bruce pointed out the 1133.50 zone is key.
Scroll to see the whole chart.
Click image for original size
Will see if it gives me the 1143 by end of session.
ES now trading 1124.50 @ 13:09 E.T.
[/quote]
[/quote]
ES now trading 1124.50 @ 13:09 E.T.
Originally posted by sandoxe
Play it one more time Sam!!!! long againg at 1122.25. stp 1119.50Originally posted by sandoxe
Ooops, got stp out. hmmm will try again latter... - 2.00 pts
Originally posted by sandoxe
Long at 1121.75. Stp at 1119.75
ES now trading 1121.00 12:52 E.T.
Originally posted by sandoxe
Price tested 1121 as support but failed. If the price is still bullish it will try to test the 1121 as resistance. If the resistance test fail and moves back up over 1121. I will buy.
Below 1121.00, next support is at 1117.00. If the price hits 1117 and test it as support and the test is a failure then I will look for the set up to sell. THe down side objective is at test of today's low 1109.50.
Will see. in due time the market will show us the way.
ES now trading 1120.50 @ 12:44 E.T.
1121.00 support (Notice that the price hit that twice this morning as support and bounced back up and to 1129.00 resistance. 1121.00 is also 1.618% from this mornings low and it's acting as support.
So what?, what does it mean? 1121.00 is an S/R place to buy from, if your charts and wiggling or none wiggling indicators say so.
[/quote]
[/quote]
Price needs lots of momo to break that 1129 resistance Right now it's hitting a small resistance trend line created by the price this morning and seeing in the 3 minute chart/ will see. Stp now at B.E. and ready to pull if I need to. Will see..
ES now trading 1126.75 @ 13:24
[/quote]
[/quote]
ES now trading 1126.75 @ 13:24
Originally posted by sandoxe
Will see if it gives me the 1143 by end of session.
ES now trading 1124.50 @ 13:09 E.T.Originally posted by sandoxe
Play it one more time Sam!!!! long againg at 1122.25. stp 1119.50Originally posted by sandoxe
Ooops, got stp out. hmmm will try again latter... - 2.00 pts
Originally posted by sandoxe
Long at 1121.75. Stp at 1119.75
ES now trading 1121.00 12:52 E.T.
Originally posted by sandoxe
Price tested 1121 as support but failed. If the price is still bullish it will try to test the 1121 as resistance. If the resistance test fail and moves back up over 1121. I will buy.
Below 1121.00, next support is at 1117.00. If the price hits 1117 and test it as support and the test is a failure then I will look for the set up to sell. THe down side objective is at test of today's low 1109.50.
Will see. in due time the market will show us the way.
ES now trading 1120.50 @ 12:44 E.T.
1121.00 support (Notice that the price hit that twice this morning as support and bounced back up and to 1129.00 resistance. 1121.00 is also 1.618% from this mornings low and it's acting as support.
So what?, what does it mean? 1121.00 is an S/R place to buy from, if your charts and wiggling or none wiggling indicators say so.
[/quote]
[/quote]
LOL keeps testing that 1129.00 as if she wants to move above. Ready to pull out if need to.
ES now trading 1128.75 @ 13:34....
[/quote]
[/quote]
ES now trading 1128.75 @ 13:34....
Originally posted by sandoxe
Price needs lots of momo to break that 1129 resistance Right now it's hitting a small resistance trend line created by the price this morning and seeing in the 3 minute chart/ will see. Stp now at B.E. and ready to pull if I need to. Will see..
ES now trading 1126.75 @ 13:24
Originally posted by sandoxe
Will see if it gives me the 1143 by end of session.
ES now trading 1124.50 @ 13:09 E.T.Originally posted by sandoxe
Play it one more time Sam!!!! long againg at 1122.25. stp 1119.50Originally posted by sandoxe
Ooops, got stp out. hmmm will try again latter... - 2.00 pts
Originally posted by sandoxe
Long at 1121.75. Stp at 1119.75
ES now trading 1121.00 12:52 E.T.
Originally posted by sandoxe
Price tested 1121 as support but failed. If the price is still bullish it will try to test the 1121 as resistance. If the resistance test fail and moves back up over 1121. I will buy.
Below 1121.00, next support is at 1117.00. If the price hits 1117 and test it as support and the test is a failure then I will look for the set up to sell. THe down side objective is at test of today's low 1109.50.
Will see. in due time the market will show us the way.
ES now trading 1120.50 @ 12:44 E.T.
1121.00 support (Notice that the price hit that twice this morning as support and bounced back up and to 1129.00 resistance. 1121.00 is also 1.618% from this mornings low and it's acting as support.
So what?, what does it mean? 1121.00 is an S/R place to buy from, if your charts and wiggling or none wiggling indicators say so.
[/quote]
[/quote]
Here we go. one more test at 1129.00 as resistance., failure on this test I will pull out
@ 1127.75 will see.
ES now trading 1128.76 @ 13:46
[/quote]
[/quote]
@ 1127.75 will see.
ES now trading 1128.76 @ 13:46
Originally posted by sandoxe
LOL keeps testing that 1129.00 as if she wants to move above. Ready to pull out if need to.
ES now trading 1128.75 @ 13:34....Originally posted by sandoxe
Price needs lots of momo to break that 1129 resistance Right now it's hitting a small resistance trend line created by the price this morning and seeing in the 3 minute chart/ will see. Stp now at B.E. and ready to pull if I need to. Will see..
ES now trading 1126.75 @ 13:24
Originally posted by sandoxe
Will see if it gives me the 1143 by end of session.
ES now trading 1124.50 @ 13:09 E.T.Originally posted by sandoxe
Play it one more time Sam!!!! long againg at 1122.25. stp 1119.50Originally posted by sandoxe
Ooops, got stp out. hmmm will try again latter... - 2.00 pts
Originally posted by sandoxe
Long at 1121.75. Stp at 1119.75
ES now trading 1121.00 12:52 E.T.
Originally posted by sandoxe
Price tested 1121 as support but failed. If the price is still bullish it will try to test the 1121 as resistance. If the resistance test fail and moves back up over 1121. I will buy.
Below 1121.00, next support is at 1117.00. If the price hits 1117 and test it as support and the test is a failure then I will look for the set up to sell. THe down side objective is at test of today's low 1109.50.
Will see. in due time the market will show us the way.
ES now trading 1120.50 @ 12:44 E.T.
1121.00 support (Notice that the price hit that twice this morning as support and bounced back up and to 1129.00 resistance. 1121.00 is also 1.618% from this mornings low and it's acting as support.
So what?, what does it mean? 1121.00 is an S/R place to buy from, if your charts and wiggling or none wiggling indicators say so.
[/quote]
[/quote]
Ok, we got above 1129.00. now my stp is at 1128.00 Will see what happen.
ES now trading 1129.75. @ 13:51 E.T.
[/quote]
[/quote]
ES now trading 1129.75. @ 13:51 E.T.
Originally posted by sandoxe
Here we go. one more test at 1129.00 as resistance., failure on this test I will pull out
@ 1127.75 will see.
ES now trading 1128.76 @ 13:46
Originally posted by sandoxe
LOL keeps testing that 1129.00 as if she wants to move above. Ready to pull out if need to.
ES now trading 1128.75 @ 13:34....Originally posted by sandoxe
Price needs lots of momo to break that 1129 resistance Right now it's hitting a small resistance trend line created by the price this morning and seeing in the 3 minute chart/ will see. Stp now at B.E. and ready to pull if I need to. Will see..
ES now trading 1126.75 @ 13:24
Originally posted by sandoxe
Will see if it gives me the 1143 by end of session.
ES now trading 1124.50 @ 13:09 E.T.Originally posted by sandoxe
Play it one more time Sam!!!! long againg at 1122.25. stp 1119.50Originally posted by sandoxe
Ooops, got stp out. hmmm will try again latter... - 2.00 pts
Originally posted by sandoxe
Long at 1121.75. Stp at 1119.75
ES now trading 1121.00 12:52 E.T.
Originally posted by sandoxe
Price tested 1121 as support but failed. If the price is still bullish it will try to test the 1121 as resistance. If the resistance test fail and moves back up over 1121. I will buy.
Below 1121.00, next support is at 1117.00. If the price hits 1117 and test it as support and the test is a failure then I will look for the set up to sell. THe down side objective is at test of today's low 1109.50.
Will see. in due time the market will show us the way.
ES now trading 1120.50 @ 12:44 E.T.
1121.00 support (Notice that the price hit that twice this morning as support and bounced back up and to 1129.00 resistance. 1121.00 is also 1.618% from this mornings low and it's acting as support.
So what?, what does it mean? 1121.00 is an S/R place to buy from, if your charts and wiggling or none wiggling indicators say so.
[/quote]
[/quote]
Sorry DT. I thought it will be just one frame if replying with a quote.
Price hit 1133. 50 resistance. (1133.50 was intraday spike high yesterday) There's a 161.8 extension at 1134 so we got an other resistance cluster here.
Will see what it does, If bullish today, it will break true.
ES now trading 1130.75 @ 14:15.
Got to go for some good java. hmmmm
Protecting stop is at 1127.50. Objective 1143 area.
Will see what it does, If bullish today, it will break true.
ES now trading 1130.75 @ 14:15.
Got to go for some good java. hmmmm
Protecting stop is at 1127.50. Objective 1143 area.
theres that 33.00 there triing to fill that in now
could be back out coming
Thanks Sandoxe, I missed your reply & just found it when researching the posts, what formula would I use to calculate these previous 3 days S/R levels?
regards Brent.T
regards Brent.T
Emini Day Trading /
Daily Notes /
Forecast /
Economic Events /
Search /
Terms and Conditions /
Disclaimer /
Books /
Online Books /
Site Map /
Contact /
Privacy Policy /
Links /
About /
Day Trading Forum /
Investment Calculators /
Pivot Point Calculator /
Market Profile Generator /
Fibonacci Calculator /
Mailing List /
Advertise Here /
Articles /
Financial Terms /
Brokers /
Software /
Holidays /
Stock Split Calendar /
Mortgage Calculator /
Donate
Copyright © 2004-2023, MyPivots. All rights reserved.
Copyright © 2004-2023, MyPivots. All rights reserved.