ES SRs and Fibs 11/11/11
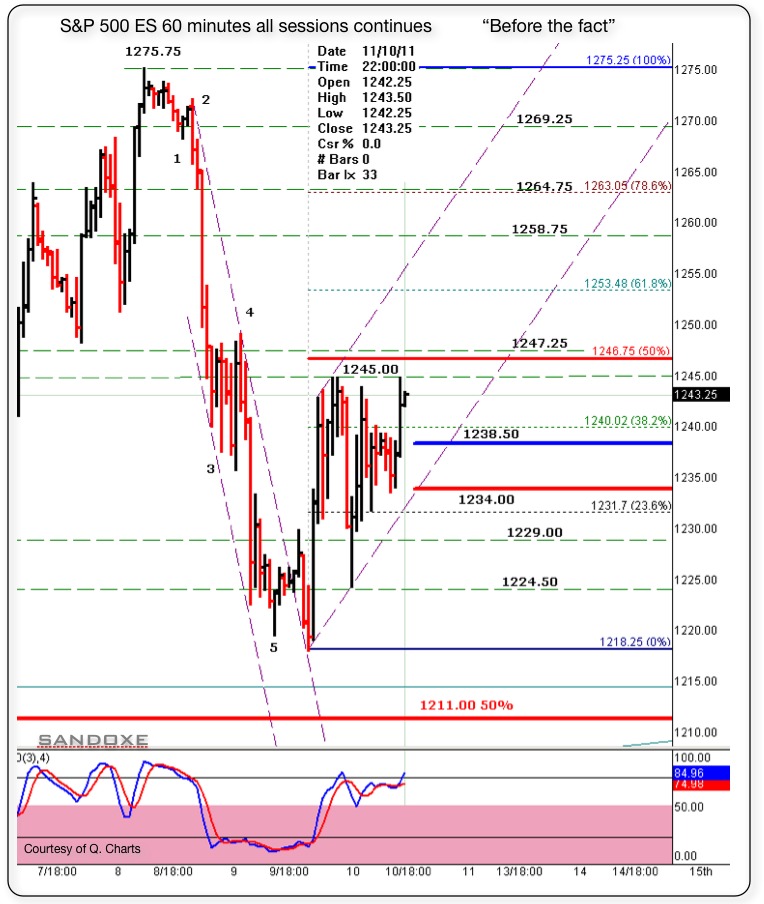
Below is a 60 minutes chart with today's session set-up. The blue (1238.50) and red line (1234.00) are my guide lines to focus on buying or selling. If the price is above 1238.50 I will focus on buying set-ups till it gets to some type of resistance to revaluate. Conversely, if the price is below 1234.00, I will focus on short set-ups till the price gets to some type of support to revaluate the trade and so on.
As always, the market has the last word and in due time will show us the way.
Right now, next hours, next days, next weeks, next months and next years to come, I see for you the same I see for my self: Having the very best of luck, fun, awesome, incredibly profitable trading experience!!
As always, the market has the last word and in due time will show us the way.
Right now, next hours, next days, next weeks, next months and next years to come, I see for you the same I see for my self: Having the very best of luck, fun, awesome, incredibly profitable trading experience!!
Click image for original size
Thx Grednfer . Looking at the 10m chart all sessions. If my count is correct, we are currently on a 4 of 3. If so then what you see in the 10m. chart as a possible top is the a,b,c,d,e formation. Market will move up after the e is completed. The objective is at 1269 end of session and a possible 1275 resistance test in O/N.
Will see in due time the market will show us the way.
ES now trading 1262.75 @ 14:40 E.T.
Will see in due time the market will show us the way.
ES now trading 1262.75 @ 14:40 E.T.
Notice also that the ES is testing that 78% retrace shown in the chart posted last night, 78% and 88% zones are the kiss off death to a trend. My count is right at that test (iV) of 3. So, if the count is correct and when the e is done (e here is downwards), ES will shot right up and true that resistance. The Q. here is how low will that "e" will go? Supports are at 1258.75. 1254.
Will see, in due time the market will show as the real deal in dollars and cents.
ES now trading 1260.00 @ 14:9
Will see, in due time the market will show as the real deal in dollars and cents.
ES now trading 1260.00 @ 14:9
Originally posted by sandoxe
Thx Grednfer . Looking at the 10m chart all sessions. If my count is correct, we are currently on a 4 of 3. If so then what you see in the 10m. chart as a possible top is the a,b,c,d,e formation. Market will move up after the e is completed. The objective is at 1269 end of session and a possible 1275 resistance test in O/N.
Will see in due time the market will show us the way.
ES now trading 1262.75 @ 14:40 E.T.
Eliot Waves are fun to trade bc you know where you are in the trade. For neophytes like me, it's tuff to find and read them. --- But getting better and better at it.
will see if I can pick it up latter this eve.
The problem with EW is that its easier to count the waves after they're done......you can see the waves but its difficult to forecast with and trade off....you can always count on that C wave going straight up though......
Originally posted by grednfer
The problem with EW is that its easier to count the waves after they're done......you can see the waves but its difficult to forecast with and trade off....you can always count on that C wave going straight up though......
That's right! If you know that it's a C wave, then C waves usually unfolds in 5 waves! So you are looking to see if it's making wave 2. of C. Wave 2 in up trend, should not touch the low of wave 1. once price clears the top of wave 2, it's most likely you are on wave 3 and they are powerful waves. As a real time example, please take a look at today's 10 minutes chart all sessions. We currently are in wave 4. So look at 3. Nice move that was.
I posted a video yesterday. In the video you will see a down trend Elliot wave unfolding. That was a lucky shot for me bc it started right from the sell line of a chart originally posted here.
Here is the link.
As always, please check your puter's volume, just in case. thx.
&feature=player_embedded
So lets put it all together.
In up trend, 5 Elliot Waves, MP traders will see the 1 and 2 at the low end of the bell, lots of volume there as support. Lisa, will see a buy block of contracts coming in at wave 2 (my block lol). Wave 3 will be filling up the bell curve. Wave 4 will be the price testing the top of the bell curve and lots of volume there. Then Lisa will see a short block of contrast coming in.-- As 4 unfolds, somewhere there, Lisa will see the same short block of contracts coming out and wave 4 is making the "e" low and wave 5 will start. If wave 5 is subdividing, then Lisa will see a block of buy contracts coming in and 5 will subdivide.
In up trend, 5 Elliot Waves, MP traders will see the 1 and 2 at the low end of the bell, lots of volume there as support. Lisa, will see a buy block of contracts coming in at wave 2 (my block lol). Wave 3 will be filling up the bell curve. Wave 4 will be the price testing the top of the bell curve and lots of volume there. Then Lisa will see a short block of contrast coming in.-- As 4 unfolds, somewhere there, Lisa will see the same short block of contracts coming out and wave 4 is making the "e" low and wave 5 will start. If wave 5 is subdividing, then Lisa will see a block of buy contracts coming in and 5 will subdivide.
Thx Vasuki. I hope he has more than one broker acct.
Originally posted by vasuki
Sandoxe just to let you know Don miller may have lose over 2 million in his MF GLOBAL account check his web site has a lot of info about the litigation and so on.
Emini Day Trading /
Daily Notes /
Forecast /
Economic Events /
Search /
Terms and Conditions /
Disclaimer /
Books /
Online Books /
Site Map /
Contact /
Privacy Policy /
Links /
About /
Day Trading Forum /
Investment Calculators /
Pivot Point Calculator /
Market Profile Generator /
Fibonacci Calculator /
Mailing List /
Advertise Here /
Articles /
Financial Terms /
Brokers /
Software /
Holidays /
Stock Split Calendar /
Mortgage Calculator /
Donate
Copyright © 2004-2023, MyPivots. All rights reserved.
Copyright © 2004-2023, MyPivots. All rights reserved.