ES Thursday 12-1-11
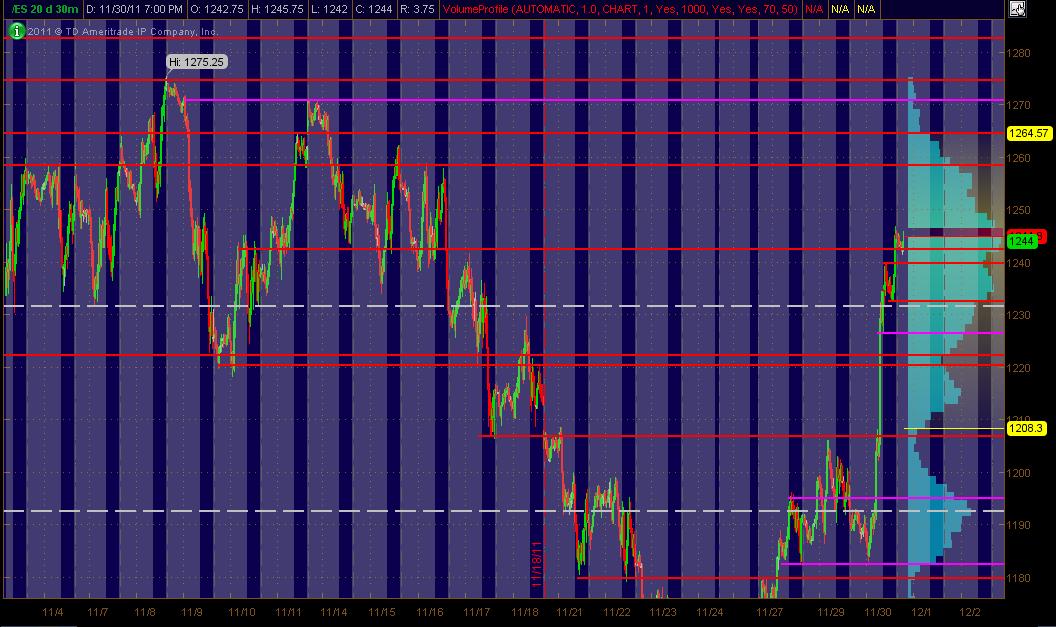
Here's what I've got for my ES MAP of PASR ZONES using a 30min chart of 20 days of data coming into Thursday's trading. The Red lines are potential significant levels with Magenta lines as semi-significant. The White dashed lines are the Weekly Pivots. The Light Blue Volume Profile of the past "rolling" 20 days is displayed on the right vertical axis. The Gray background shows non-RTH price activity. Hope this is helpful to some as a "MAP"
This is such a news (geopolitical) driven market currently ... so be wary and careful.
Click image for original size
This is such a news (geopolitical) driven market currently ... so be wary and careful.
high volume 1241.75
Click image for original size
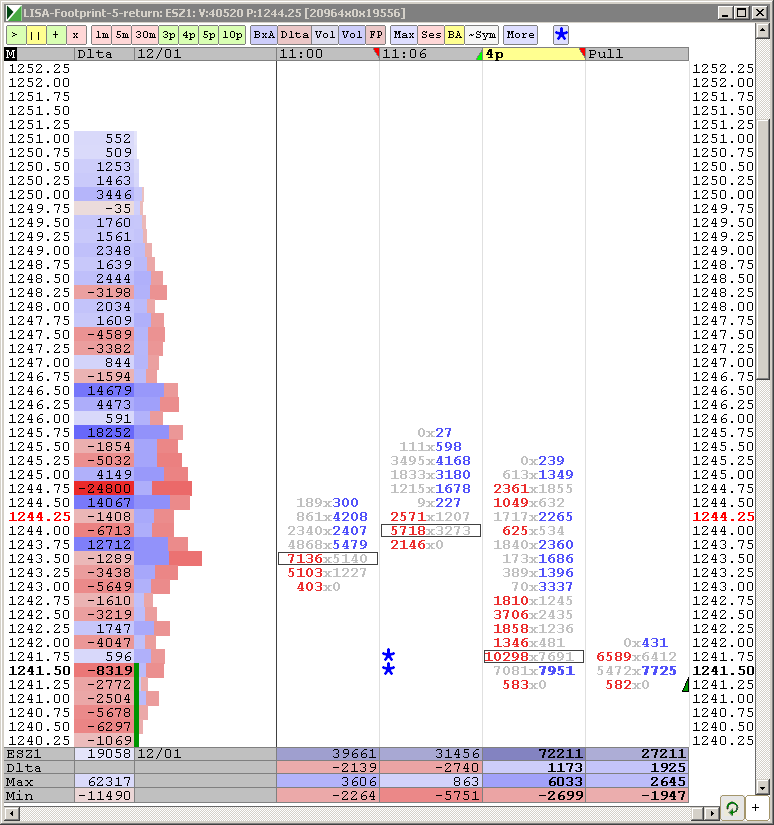
ES singles filled
Above 43.75 those shorts will be a "rocket fuel"
Click image for original size
IS anyone here? Should I post? I am afraind of turning into Tradezilla.
Nah..you're fine..just feels like a resting day in the market...
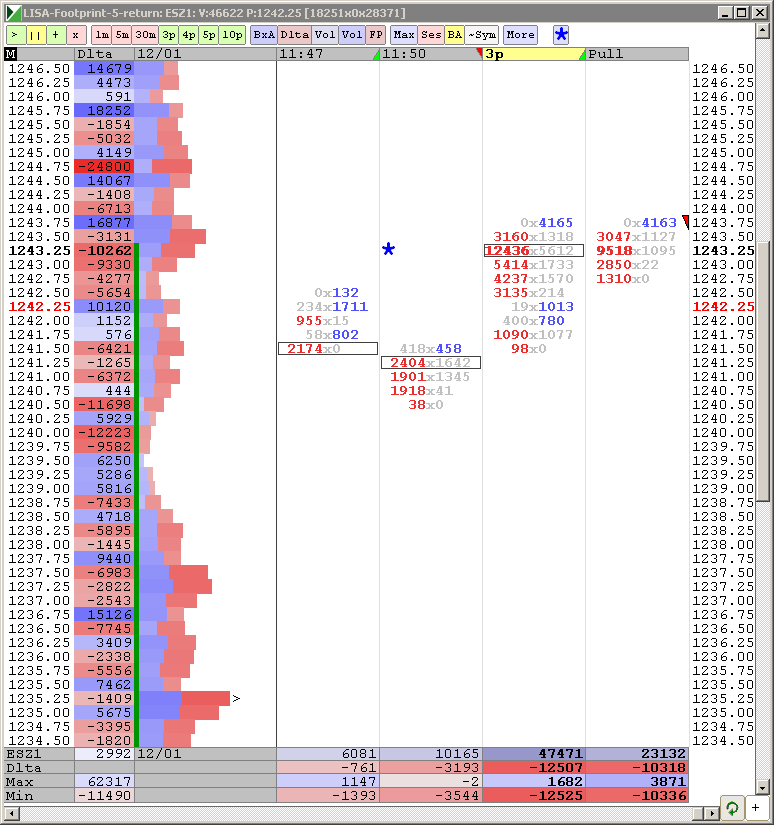
your doing great just fliping around here 44.50 is the vwap thats what i have staying below it
New here. Always looking for new ideas although over the past few years I keep paring back on info and indicators that I use to place trades.. great day yesterday and even today the volume is almost 1.6 million contracts...amazing. May your next trade be profitable.
Hi Lisa,can yoy explain more on this wiskoff volum prof,is it delta volume numbers or ...please elaborate more and how to collect this data from TOS, tank you
Emini Day Trading /
Daily Notes /
Forecast /
Economic Events /
Search /
Terms and Conditions /
Disclaimer /
Books /
Online Books /
Site Map /
Contact /
Privacy Policy /
Links /
About /
Day Trading Forum /
Investment Calculators /
Pivot Point Calculator /
Market Profile Generator /
Fibonacci Calculator /
Mailing List /
Advertise Here /
Articles /
Financial Terms /
Brokers /
Software /
Holidays /
Stock Split Calendar /
Mortgage Calculator /
Donate
Copyright © 2004-2023, MyPivots. All rights reserved.
Copyright © 2004-2023, MyPivots. All rights reserved.