ES Thursday 12-1-11
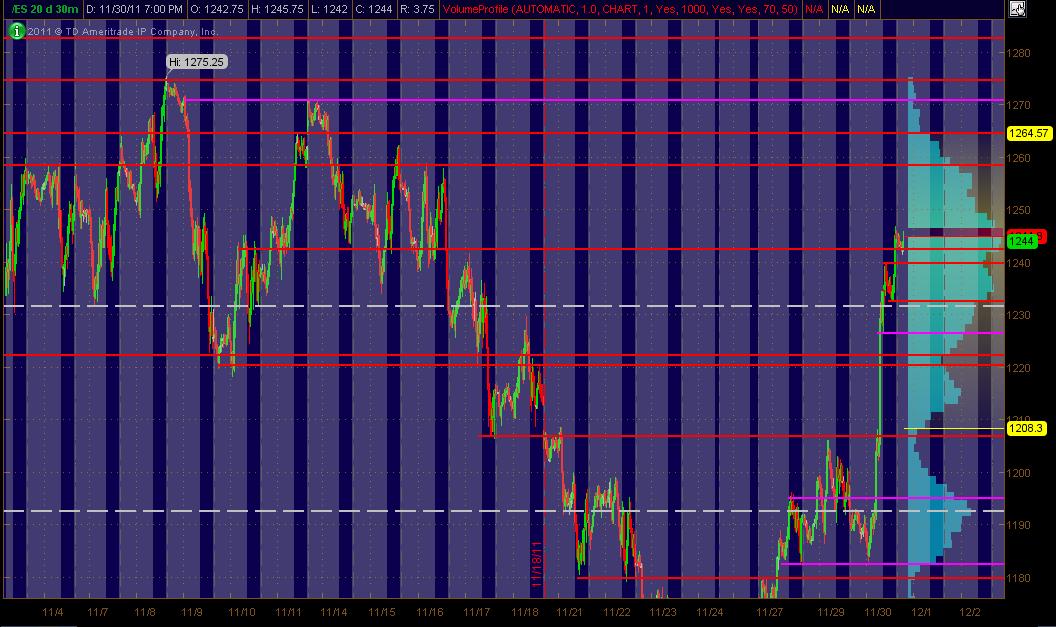
Here's what I've got for my ES MAP of PASR ZONES using a 30min chart of 20 days of data coming into Thursday's trading. The Red lines are potential significant levels with Magenta lines as semi-significant. The White dashed lines are the Weekly Pivots. The Light Blue Volume Profile of the past "rolling" 20 days is displayed on the right vertical axis. The Gray background shows non-RTH price activity. Hope this is helpful to some as a "MAP"
This is such a news (geopolitical) driven market currently ... so be wary and careful.
Click image for original size
This is such a news (geopolitical) driven market currently ... so be wary and careful.
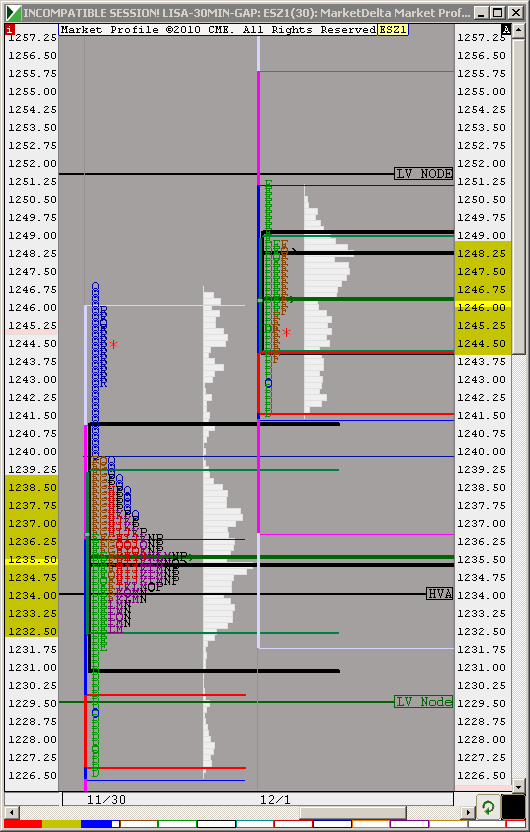
GM on the down side i have 40.75 (rat 43.75)overnight we went back to 36 HVN (RAT MATH 38)
31.25 LVN 25.25LVN
That 38.75 was a LVN from overnight I have a HVN yesterday 35.10
31.25 LVN 25.25LVN
That 38.75 was a LVN from overnight I have a HVN yesterday 35.10
Reminder: RTH untested break-down at 1250 or so
2 reports in 5 min......
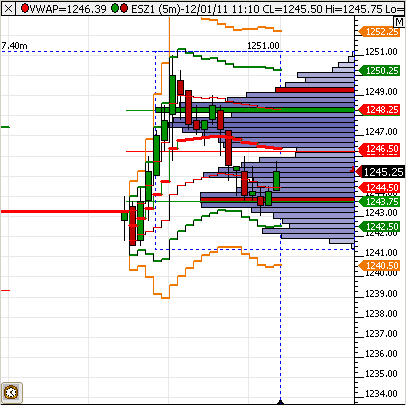
bingo 1250
so far nice trade hit that 50 lisa poss 43 will come with 1 little runner
Lay of the land. Singles below
Click image for original size
I have all three markets at significant resistance on daily
But watching INDU. Tough spot, so playing light, scalps for now
Click image for original size
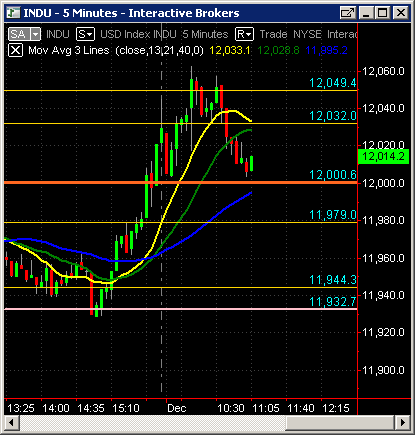
INDU below 12k now
Hi Lisa,can yoy explain more on this wiskoff volum prof,is it delta volume numbers or ...please elaborate more and how to collect this data from TOS, tank you
Emini Day Trading /
Daily Notes /
Forecast /
Economic Events /
Search /
Terms and Conditions /
Disclaimer /
Books /
Online Books /
Site Map /
Contact /
Privacy Policy /
Links /
About /
Day Trading Forum /
Investment Calculators /
Pivot Point Calculator /
Market Profile Generator /
Fibonacci Calculator /
Mailing List /
Advertise Here /
Articles /
Financial Terms /
Brokers /
Software /
Holidays /
Stock Split Calendar /
Mortgage Calculator /
Donate
Copyright © 2004-2023, MyPivots. All rights reserved.
Copyright © 2004-2023, MyPivots. All rights reserved.