ES Tuesday 12-6-11
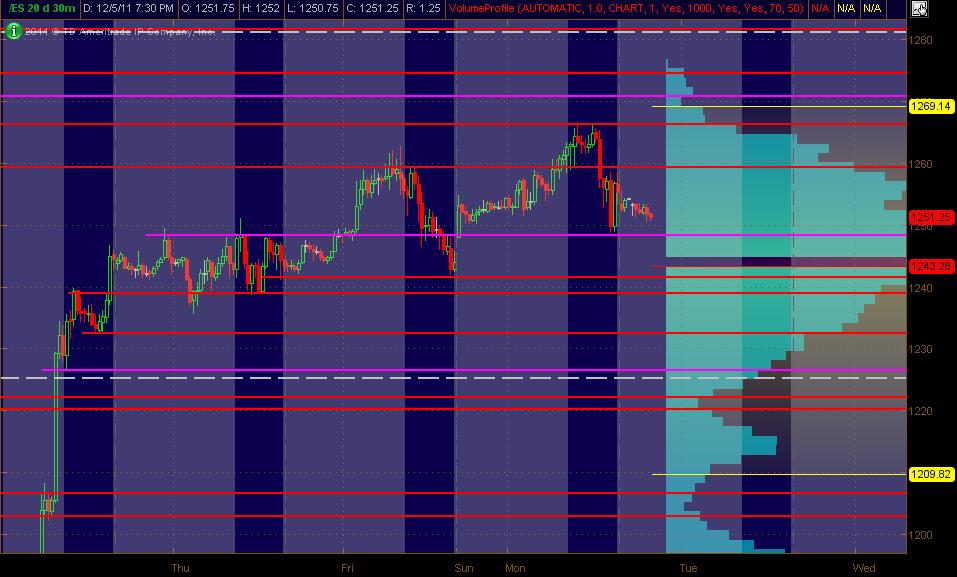
Here's what I've got for my ES MAP of PASR ZONES using a 30min chart of 20 days of data coming into Tuesday's trading. The Red lines are potential significant levels with Magenta lines as semi-significant. The White dashed lines are the Weekly Pivots. The Light Blue Volume Profile of the past "rolling" 20 days is displayed on the right vertical axis. The Gray background shows non-RTH price activity. Hope, as always, that this is helpful to some as a "MAP"
Near current ES price, I've got these as additional price level info:
1274-75 PASR / Daily R2 Pvt (based on RTH) / Fib Cluster
1260-61 PASR / 1 and 2 Day VolProf LVN (as per TOS platform)
1241-39 PASR signif "zone"
(obviously, some other levels are on the chart in between these to take notice of ... but these, to me, seem the most significant fwiw)
Click image for original size
Near current ES price, I've got these as additional price level info:
1274-75 PASR / Daily R2 Pvt (based on RTH) / Fib Cluster
1260-61 PASR / 1 and 2 Day VolProf LVN (as per TOS platform)
1241-39 PASR signif "zone"
(obviously, some other levels are on the chart in between these to take notice of ... but these, to me, seem the most significant fwiw)
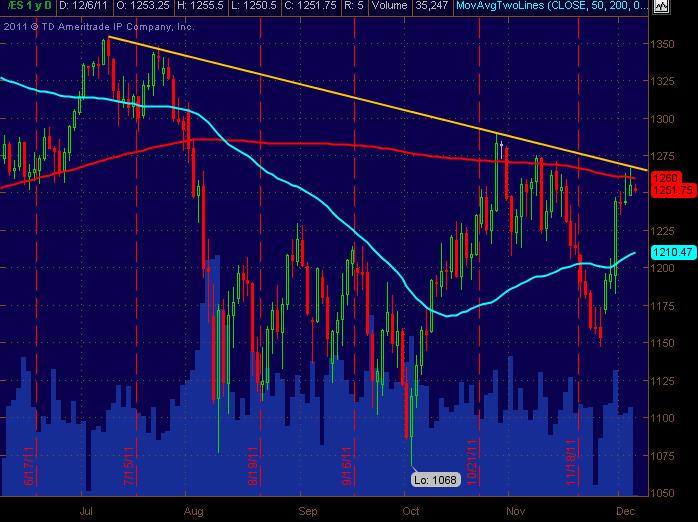
And the ES Daily (all trading hours) for a bigger pic of what's going on. I'm sure everyone has this ... but wanted to include it alongside the 30min chart. The Cyan line is a 50 day SMA and Red is 200 day SMA ... with a downward sloping Yellow Trendline. 200SMA and Trendline "might" serve as resistance ... as they are very near each other with price currently. Just didn't want to be myopic in the chart analysis.
Click image for original size
Thanks MM. Always good to see another's view point.
So far my overnight target was 1261.50 (overnight session ABC 2.618 projection) which was satisfied this morning.
Above that is the HVN at 1263.75 from yesterday
Singles at 59 have been filled overnight
Below that are two HVN's at 1257.00 and 1255.50
Above that is the HVN at 1263.75 from yesterday
Singles at 59 have been filled overnight
Below that are two HVN's at 1257.00 and 1255.50
we have RATS at 56 and 62.00 , 68 up side 43 75 rat on lower end
LVN 54.25 and 52.50 and 46.50 from yesterday on the down side
upside 59 and 61 LVN we are close to all
LVN 54.25 and 52.50 and 46.50 from yesterday on the down side
upside 59 and 61 LVN we are close to all
The overnight has confirmed the VA low from yesterday by creating peak volume overnight so the 56 number is important. Also we had a low volume node from yesterday at 51.75 and the overnight has a nice swing low there. Another key spot.
we still have low volume at 59 with overnight volume added into yesterdays day session so that is still important to me.
Perhaps the most important areas to monitor will be the overnight high up into the peak volume of yesterday at 63.50 and the overnight low into the critical 43.75. I've set up a band of S/R at those areas to monitor as we go forward.
Many feel neutral days follow neutral days and yesterday was a neutral day. We are set to open inside the middle of the overnight and day session range so we can expect two sided trade and look to fade on the first pushes away from that middle. Using the 56 as a magnet. I don't expect great trends today unless some random news hits the market and no reports are scheduled early on.
My comments are not much more than a recap of the numbers you all have so sorry for being redundant!
begining to look for buys under 52.50...air pockets above
Volume
Click image for original size
This could be titled the Thrifty traders guide to value - for those who don't want to spend money on expensive software.
Yesterday we had 10 thirty minute bars that passed through a common price of about 1263 in RTH. Now since today is inside of yesterday we can also count the bars that pass through a common price. Today we have 10 bars so far that have passed through a price of about 1156. This tells us that the market so far is accepting price at a lower common denominator than it was yesterday morning. Value is lower.
The failure so far outside of the hour highs into our key low volume number and the inability of the market to close on a thirty minute basis above that zone is telling us something right now. As value traders we constantly monitor for subtle signs of change.
So far an inside day and opportunity is limited in my view. I don't diddle in the middle so the 56 is still in use as a magnet and not a point to initiate trades from
boy this @TF is week
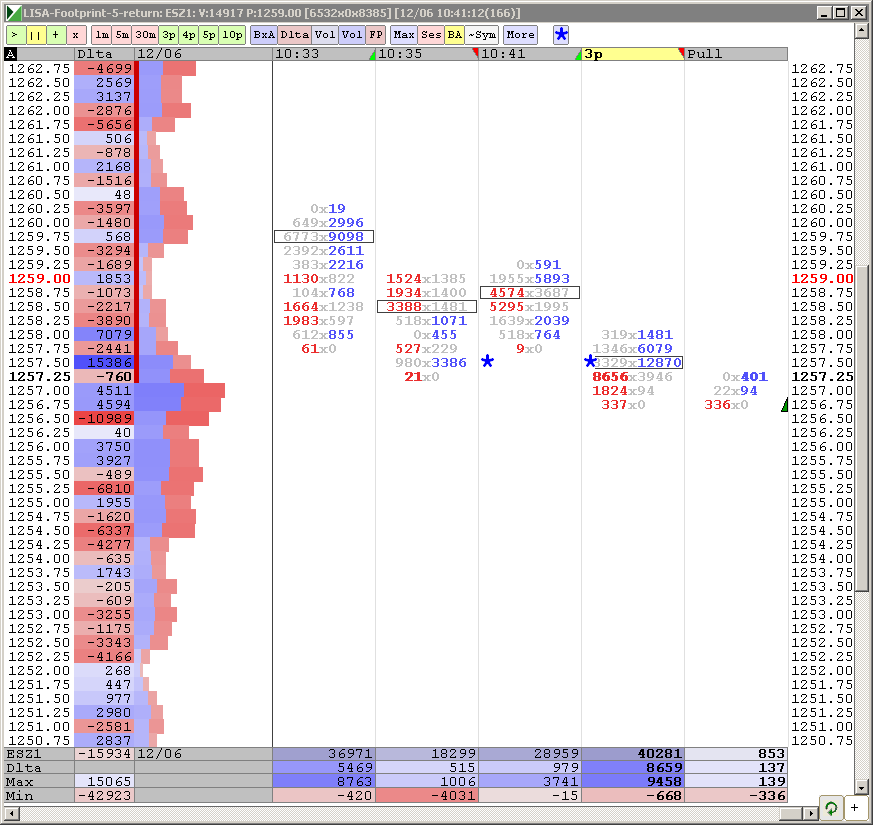
any VOL fotprint anywhere up here LISA
Thanks Bruce and all. Bruce, nice to have you back!
Emini Day Trading /
Daily Notes /
Forecast /
Economic Events /
Search /
Terms and Conditions /
Disclaimer /
Books /
Online Books /
Site Map /
Contact /
Privacy Policy /
Links /
About /
Day Trading Forum /
Investment Calculators /
Pivot Point Calculator /
Market Profile Generator /
Fibonacci Calculator /
Mailing List /
Advertise Here /
Articles /
Financial Terms /
Brokers /
Software /
Holidays /
Stock Split Calendar /
Mortgage Calculator /
Donate
Copyright © 2004-2023, MyPivots. All rights reserved.
Copyright © 2004-2023, MyPivots. All rights reserved.