ES Monday 12-12-11
Just rolled in this Sunday evening from Jerryland where I watched my Cowboys give away the game to the NY Giants ugh! Anyway ...
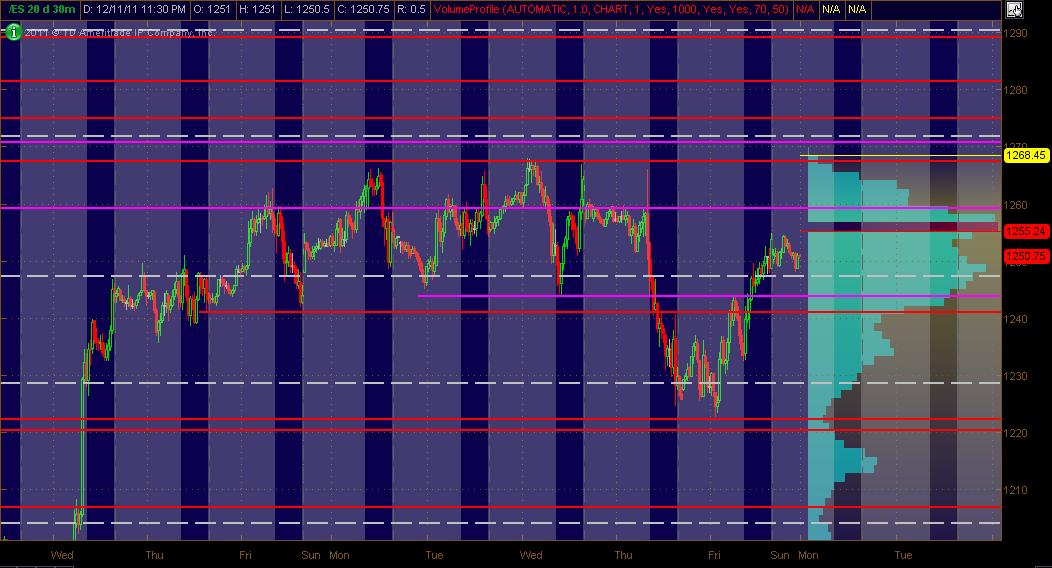
Here's what I've got for my ES MAP of PASR ZONES using a 30min chart of 20 days of data coming into Monday's trading. The Red lines are potential significant levels with Magenta lines as semi-significant. The White dashed lines are the Weekly Pivots. The Light Blue Volume Profile of the past "rolling" 20 days is displayed on the right vertical axis. The Gray background shows non-RTH price activity. Hope, as always, that this is helpful to some as a "MAP"
I know I don't have anything between the 1220-1240 area drawn in ... just couldn't find anything solid enough that I was comfortable to slap a line on. BUT, a couple of places I'll also be watching are the 1230 and 1236 areas. Go Cowboys!
Here's what I've got for my ES MAP of PASR ZONES using a 30min chart of 20 days of data coming into Monday's trading. The Red lines are potential significant levels with Magenta lines as semi-significant. The White dashed lines are the Weekly Pivots. The Light Blue Volume Profile of the past "rolling" 20 days is displayed on the right vertical axis. The Gray background shows non-RTH price activity. Hope, as always, that this is helpful to some as a "MAP"
Click image for original size
I know I don't have anything between the 1220-1240 area drawn in ... just couldn't find anything solid enough that I was comfortable to slap a line on. BUT, a couple of places I'll also be watching are the 1230 and 1236 areas. Go Cowboys!
runners stopped again.......did 5 campaigns today... 3 winners, one loss and one just at cost....a better day than friday but without runners behaving it's just a marginal day...
the Ym is trying to lead this and I don't like shorts when YM is trying to lead..
the Ym is trying to lead this and I don't like shorts when YM is trying to lead..
trying longs from 20.50....this is second set of singles trying to form...
next number below is 17.50 but I 'm lookingto target the 24.50 in front of last weeks low retest
Meanwhile, during quiet time...
Click image for original size
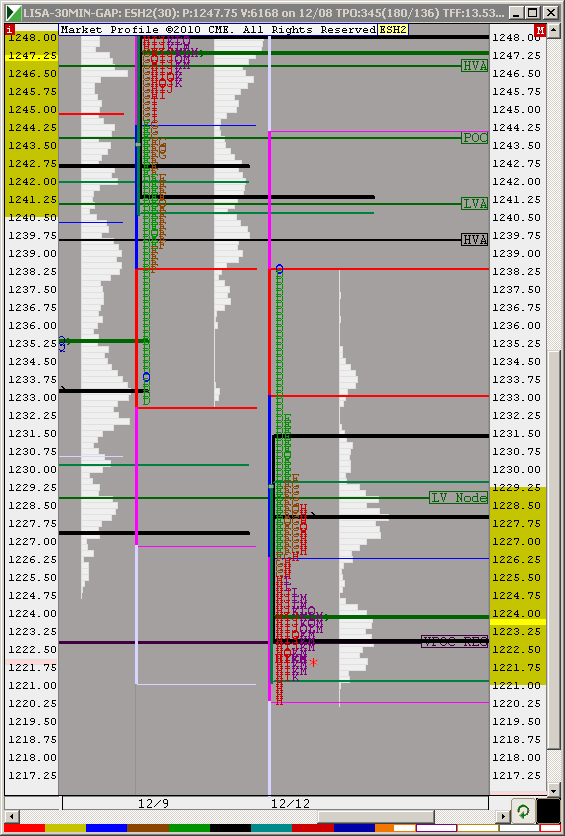
VPOC taken, mission accomplished - now what? Can anyone post levels below? My charts do not go far today. Thanks
Click image for original size
Hello all, how can I post charts to the stream?
http://www.charthub.com/images/2011/12/12/SMCCL_ES_IDAY
http://www.charthub.com/images/2011/12/12/SMCCL_ES_IDAY
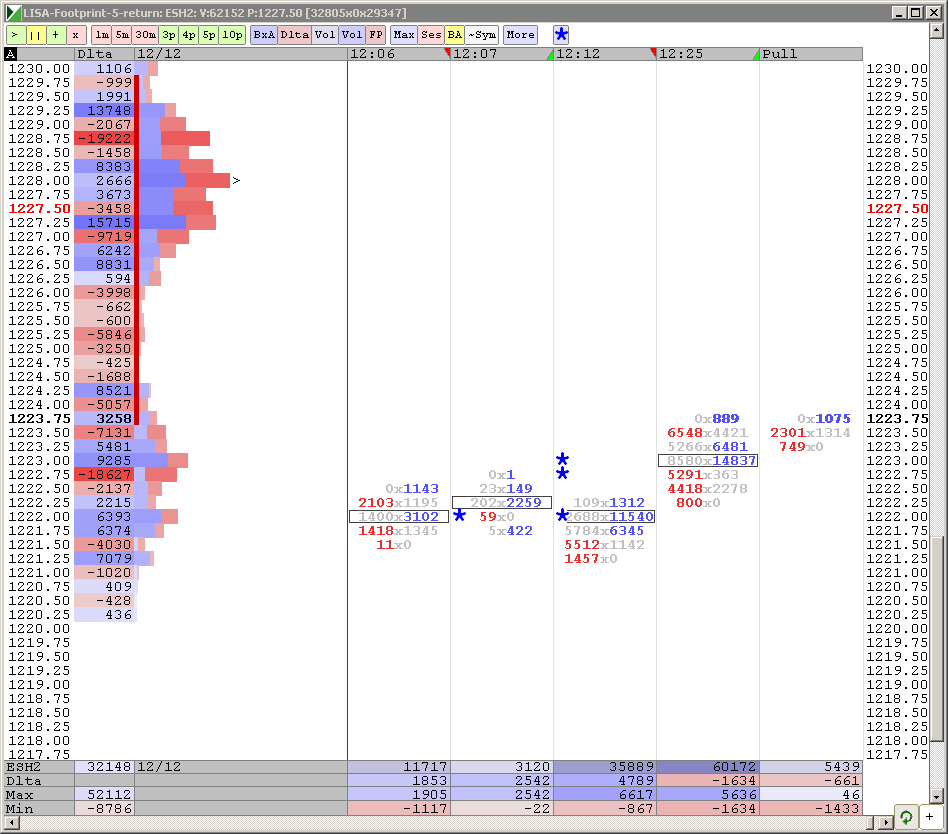
I have been following the stream here for some time, I want to thank you all for the great charts & information, I would like to contribute & am happy to explain my charts if anyone is interested. I use IRT with DTN data & am heavy into delta & order flow analysis
yes please explain...I think we'd all appreciate it....
in order to post charts here just click on "upload" and then find it on your computer with "browse"..then select it and upload..
in order to post charts here just click on "upload" and then find it on your computer with "browse"..then select it and upload..
lisa.. I am not seeing where you had that 22.75 VPOC ? What data feed r u using now? and is that Volume or time at 22.75..? I can't find it...just doing a data check...
I have an overnight high volume node at 1213.50....can anyone confirm this ? this would have been from november 29th.....not trading until I clear up some data issues
Here are the instructions:
http://www.mypivots.com/board/topic/10/-1/how-to-upload-charts-and-images-to-the-forum
http://www.mypivots.com/board/topic/10/-1/how-to-upload-charts-and-images-to-the-forum
Originally posted by Futurestr8r
Hello all, how can I post charts to the stream?
Emini Day Trading /
Daily Notes /
Forecast /
Economic Events /
Search /
Terms and Conditions /
Disclaimer /
Books /
Online Books /
Site Map /
Contact /
Privacy Policy /
Links /
About /
Day Trading Forum /
Investment Calculators /
Pivot Point Calculator /
Market Profile Generator /
Fibonacci Calculator /
Mailing List /
Advertise Here /
Articles /
Financial Terms /
Brokers /
Software /
Holidays /
Stock Split Calendar /
Mortgage Calculator /
Donate
Copyright © 2004-2023, MyPivots. All rights reserved.
Copyright © 2004-2023, MyPivots. All rights reserved.