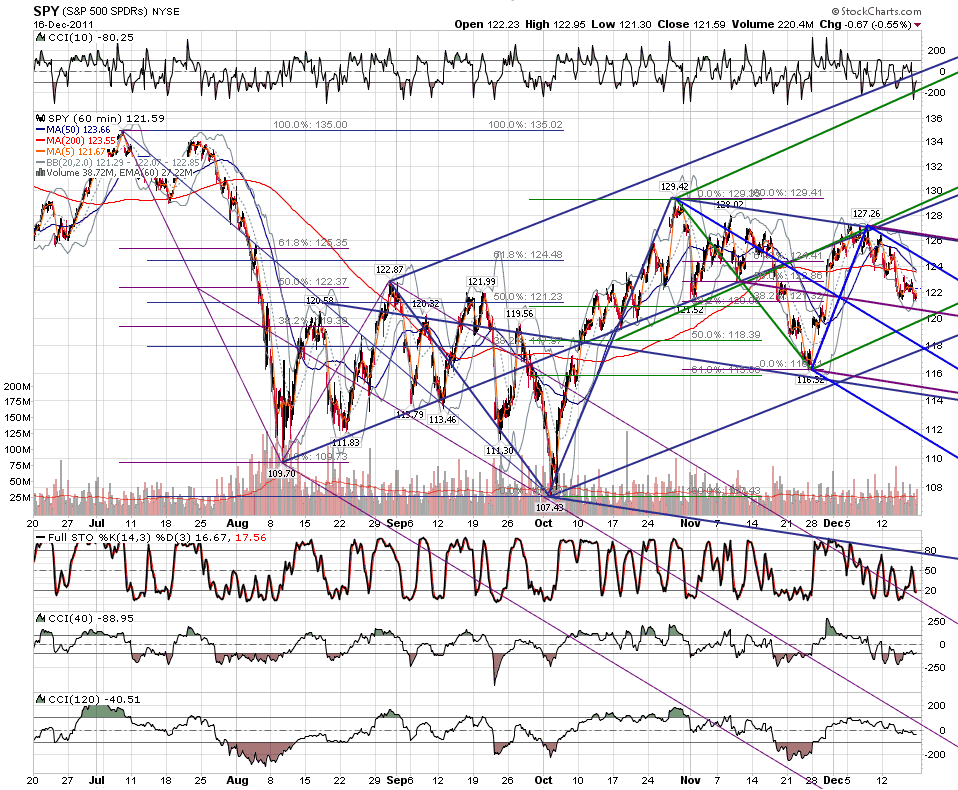
Here it is.
Al Kamego
RO
roofer
Rep: 3,689
Posts: 3,574
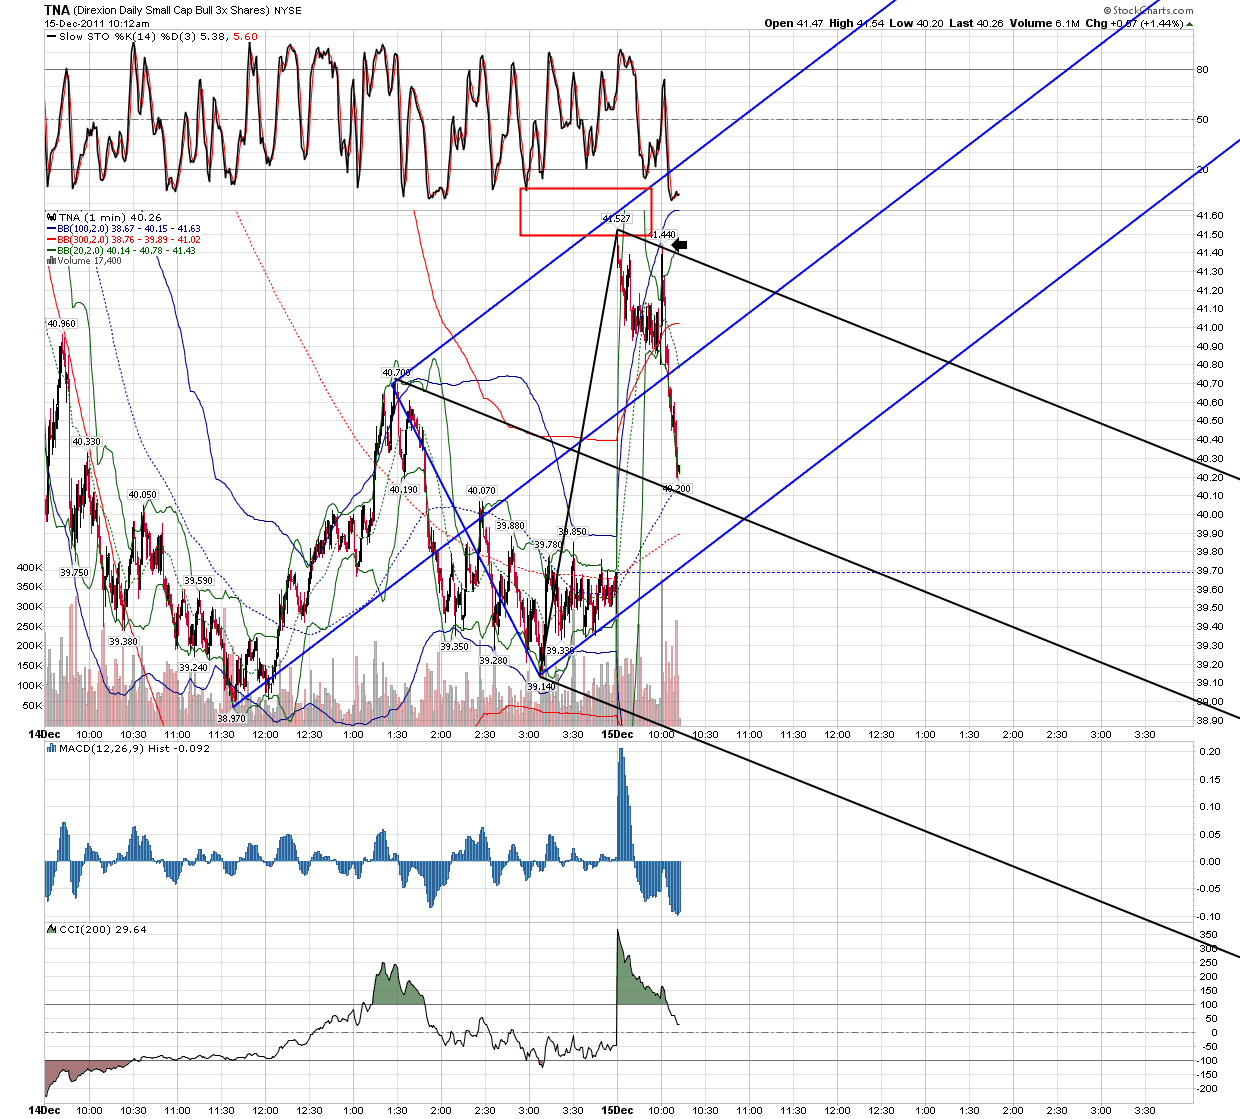
the area in box was max retrace..... just the tools
Click image for original size
RO
roofer
Rep: 3,689
Posts: 3,574
sell triggerd by .886 algo, now we have to consider poss of larger ABCD....
Click image for original size
AL
albert
Rep: 99
Posts: 3,094
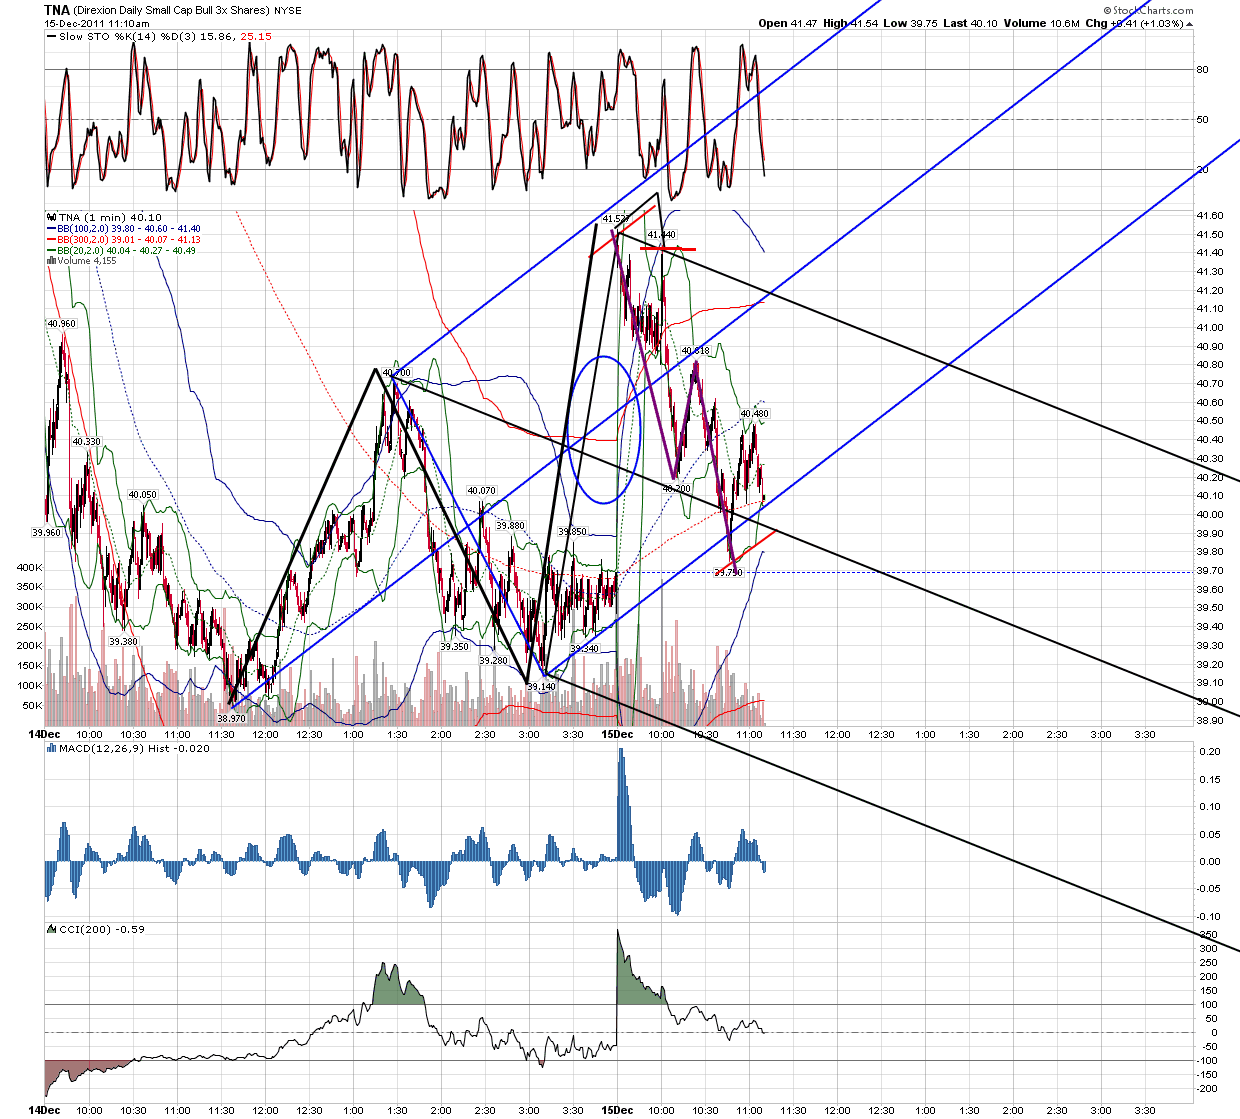
Kane TD ABCD completing at 0.500 fibo. Stop run to 2 ticks above Point B of ABCD. Very nice follow-thru.
I am still paper trading. Wow, application of the material I have seen in this forum nails the price action better than anything else I have seen or tried. KaneTrading rocks.
Caveat: I do not necessarily trade, or trade successfully, the setups I post here.
Al Kamego
I am still paper trading. Wow, application of the material I have seen in this forum nails the price action better than anything else I have seen or tried. KaneTrading rocks.
Caveat: I do not necessarily trade, or trade successfully, the setups I post here.
Al Kamego
Click image for original size
RA
rat89
Rep: 0
Posts: 7,015
see that little move up to the .447 basically coincident with the first hour low? that small abcd could send it down. my question is whether yesterday's low gets taken out today or tomorrow...
JI
jimkane
Rep: 3,058
Posts: 33,089
What a coil, a battle of timeframes we are in right at this spot. Many opposing patterns.
JI
jimkane
Rep: 3,058
Posts: 33,089
Originally posted by jimkane
I don't want to post too many areas, but keep an eye on 15.50. It's close enough now that that may influence it, but 15.50 is 'center of the area'. So:
15.50
1218-19
1223.50-1225.50
So, let's follow up on this. Some interesting things happened. It's too hard to just post the levels, and then follow up, when dynamic things happen on the way and require taking that in to account. So, on first look, this went to 1214.50, and then pulled back 8.50 points. This happened within 1 point, 4 ticks, of the first level, which was posted as a single number. Center of the area. Not bad.
Then it went to 1220.50. The next level was 1218-19, center of the area. Well, within 1.50 points, within the range of the full width of the grouping. Sometimes they nail them dead on, sometimes they 'peek around', as joed calls it. But, these are just numbers, listed in advance so one can do the work. What did the chart show?
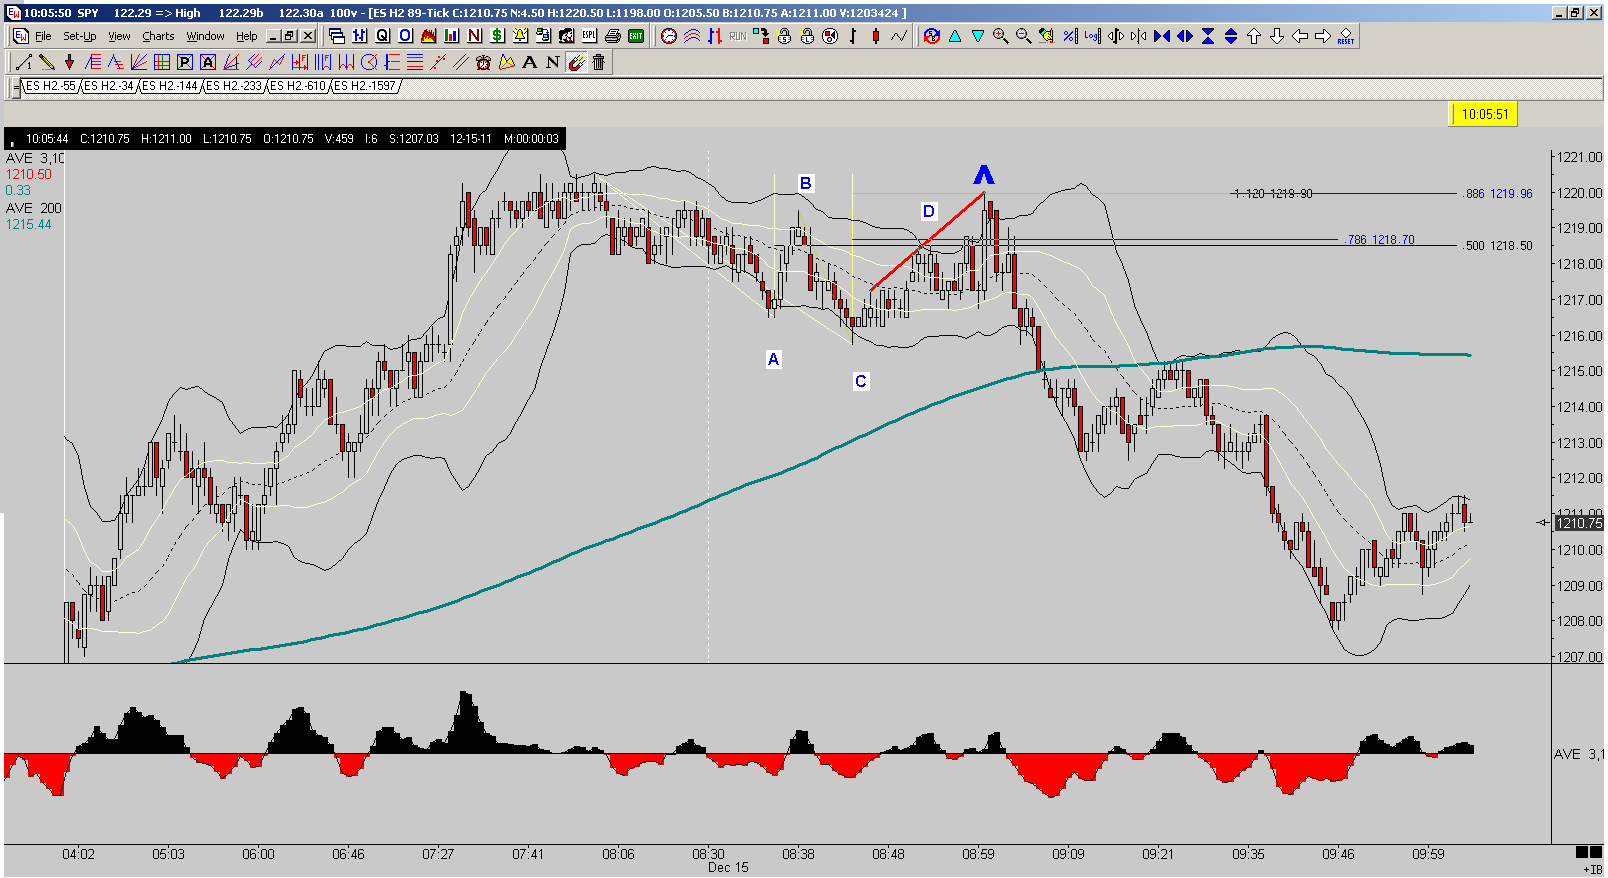
I can show one simple thing that really shows why the levels, as posted, are just a starting point for work, not a be all end all level. Look at this chart and I'll explain.
Click image for original size
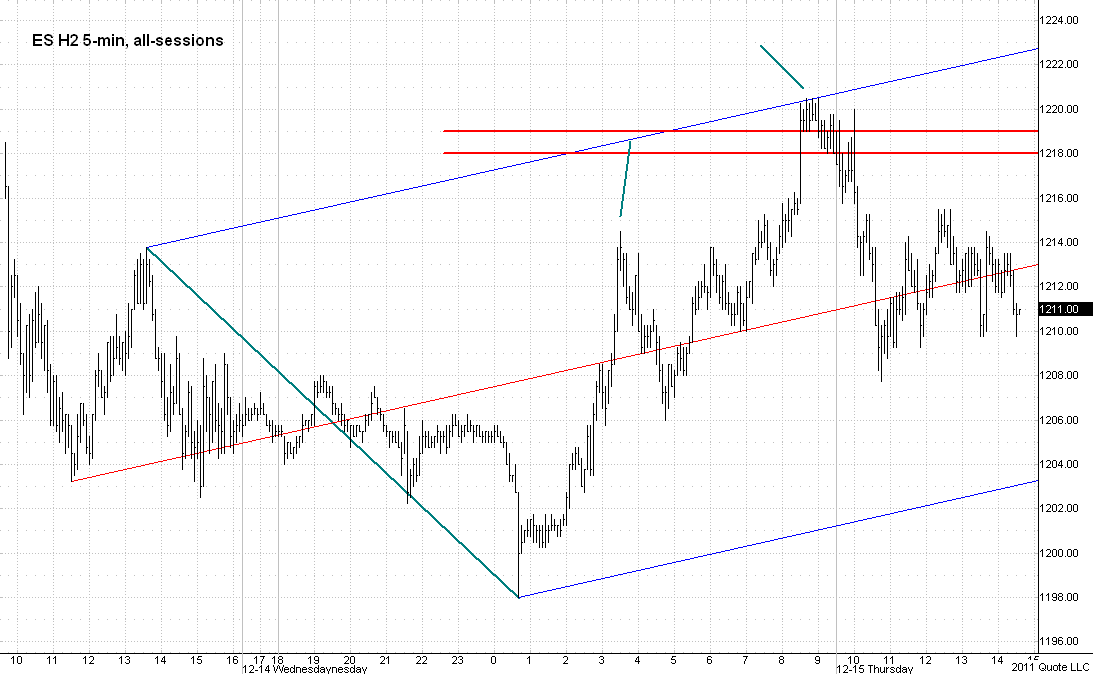
Notice the level, highlighted by the red horizontal lines, and where it hits that standard ML set upper //. But it hit near the first level, and came way back in, forming a potential BC leg. It then hit the upper area much later in time than anticipated. Notice how it handled this.
It went to the furthest boundary of the level (not shown, as I showed the center of the area), to reach the upper // fully, and then it dumped. So, how good did my level pick off that top? I'd say with near pinpoint precision. Understand, this isn't showing any other linework or the full grouping. I'm just showing the key line that demonstrates why, to me, this was a dead hit on my level. One must have the work, not a tiny little level and that's it.
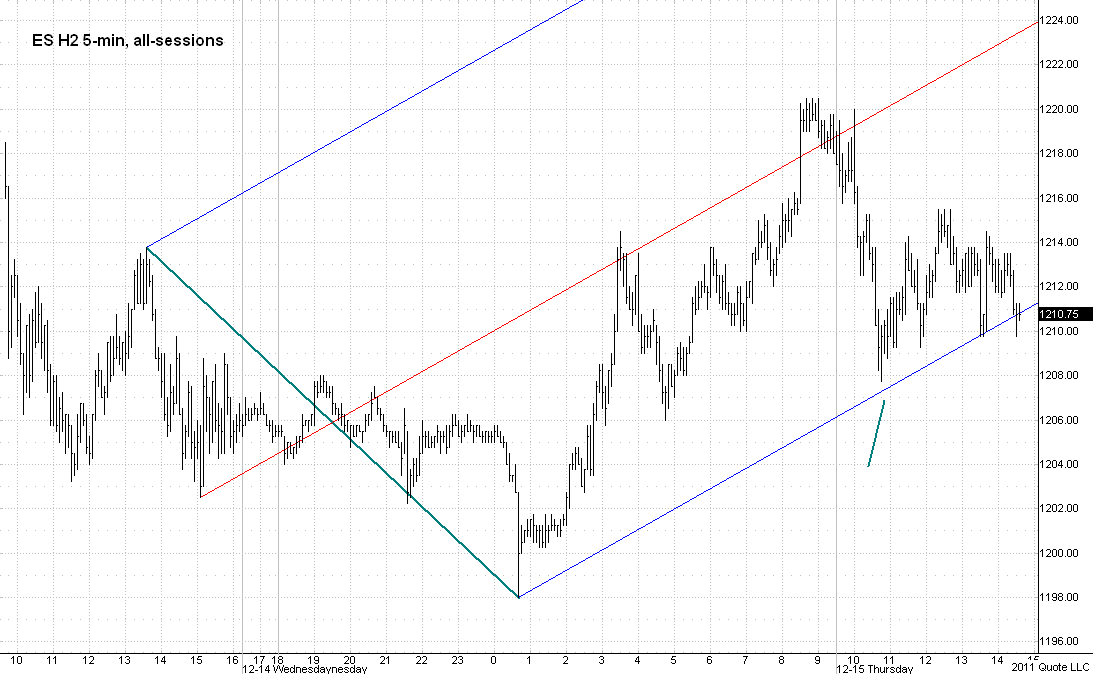
Now, this starts down, and stops dead at a spot, and after several bounces seems to come right back down to a specific price flow. I also tried another unconventional set as a variation of the last set. If you look at the chart I posted recently with all the various sets on there, you can see why I would be willing to experiment like this. Notice what the lower // showed me.
Click image for original size
Charts created on QCharts, courtesy eSignal
JI
jimkane
Rep: 3,058
Posts: 33,089
And notice how that lower // gave way, but the most likely move, I felt, would be a fake trap and then back up. It did exactly that, and is now at the 'backtest' level. Now we see.