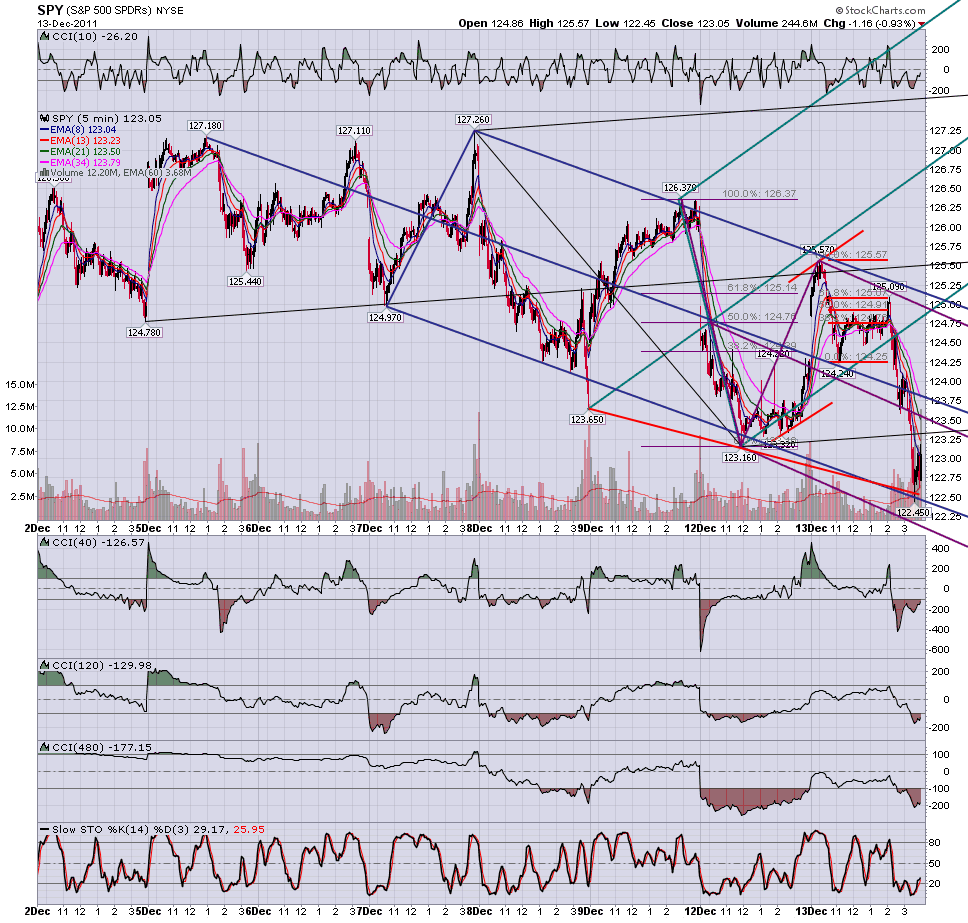
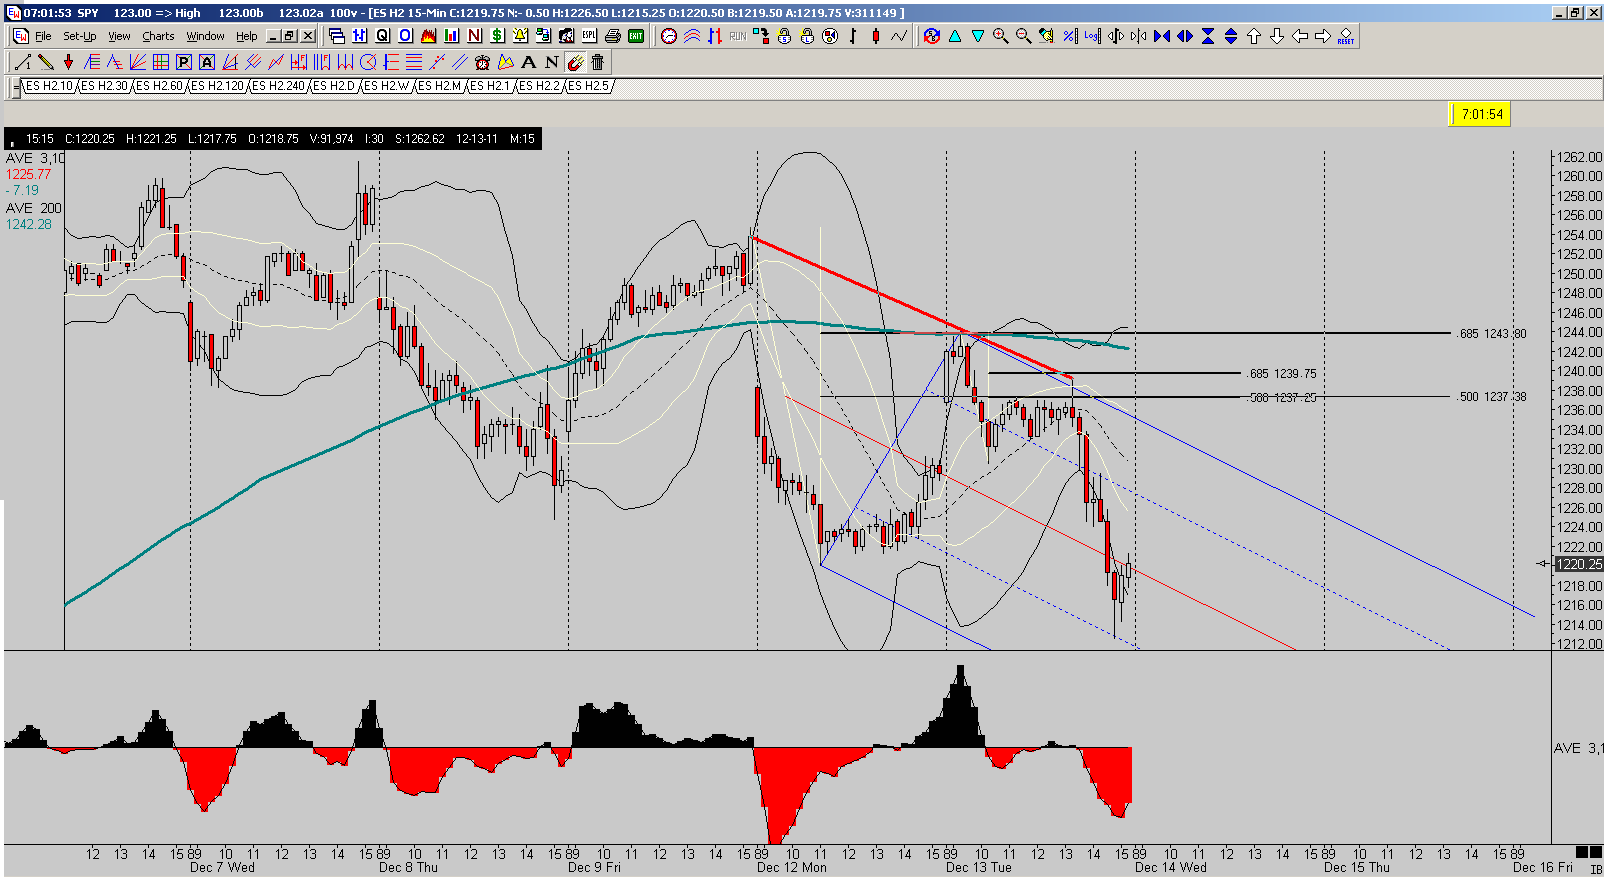
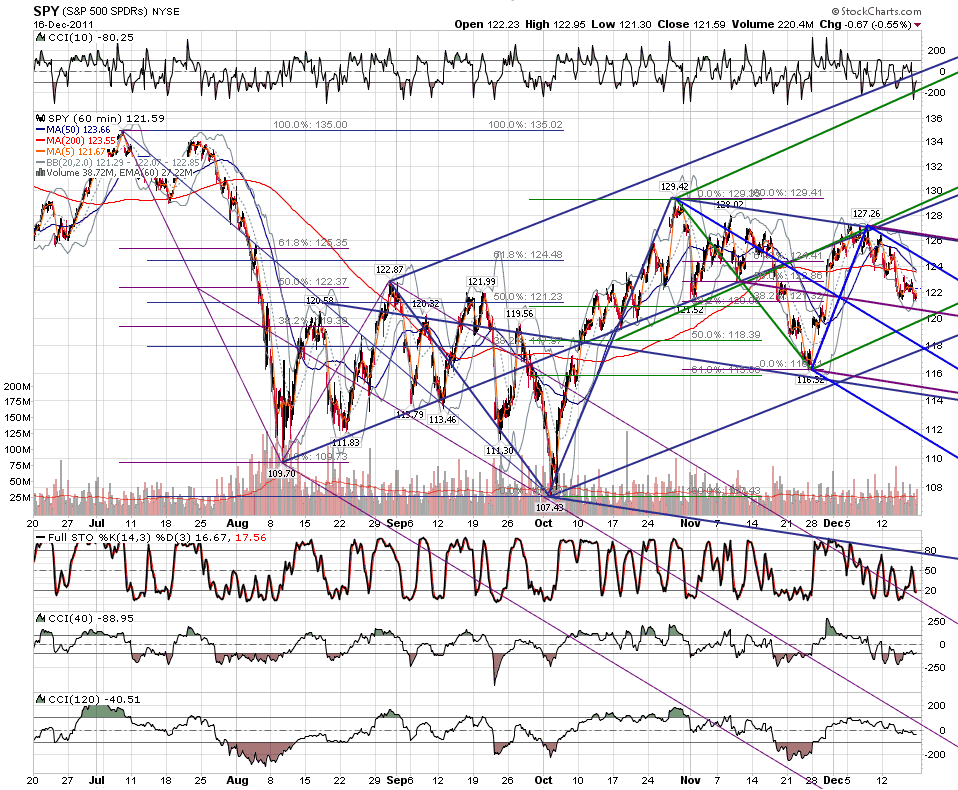
Here it is.
Al Kamego
JI
jimkane
Rep: 3,058
Posts: 33,089
Now over 16 off the low...
Originally posted by jimkane
GC now about 10 so far off my area...
JI
jimkane
Rep: 3,058
Posts: 33,089
Okay, nice charts. Now, forgive me, but can you ask me again what it is you are wondering? I think perhaps I am not as strict with Elliott as many think. I only use 'practical' Elliott, as it helps my trading. That's why I say a lot of things like 'behaves like a 'W2'' or 'To a typical 'W4' area', and things of that sort.
I find many/most of the Elliott rules don't apply to/work with my trading, but some key concepts are extremely helpful, and I use those as critical elements to my approach. So, I suspect what you may be wondering is going to be something that fits Elliott but is something I don't find works for my own trading. We'll see. Sorry I am not quite clear already on the question. Sometimes it's real hard to do this in writing. But I think we can.
I find many/most of the Elliott rules don't apply to/work with my trading, but some key concepts are extremely helpful, and I use those as critical elements to my approach. So, I suspect what you may be wondering is going to be something that fits Elliott but is something I don't find works for my own trading. We'll see. Sorry I am not quite clear already on the question. Sometimes it's real hard to do this in writing. But I think we can.
Originally posted by sirios
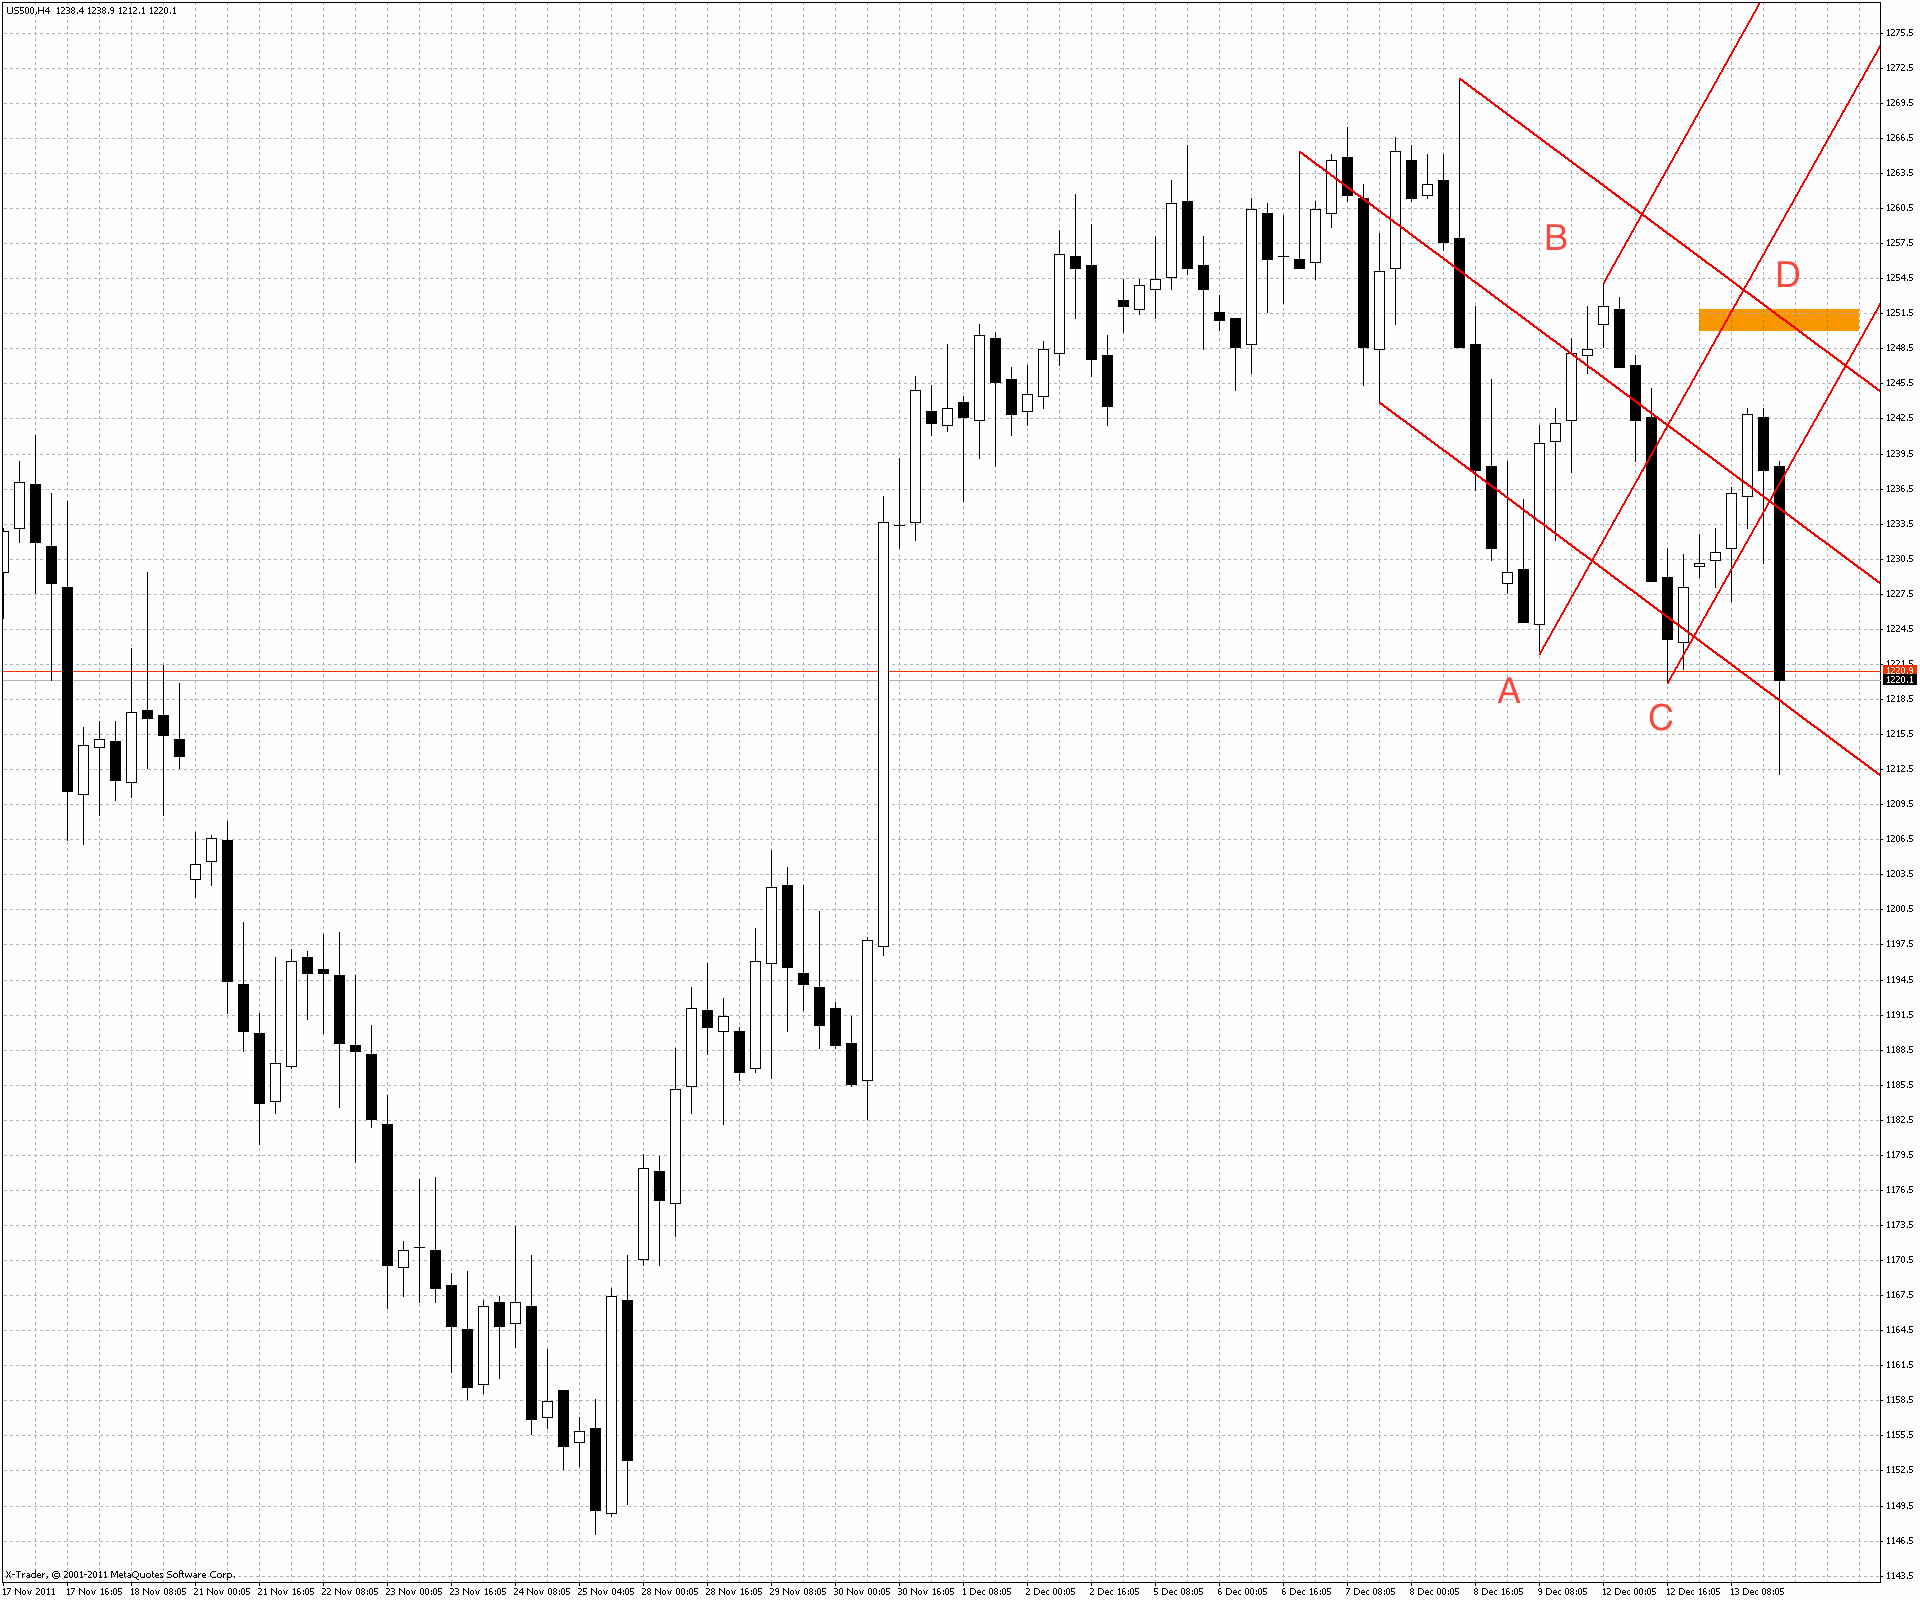
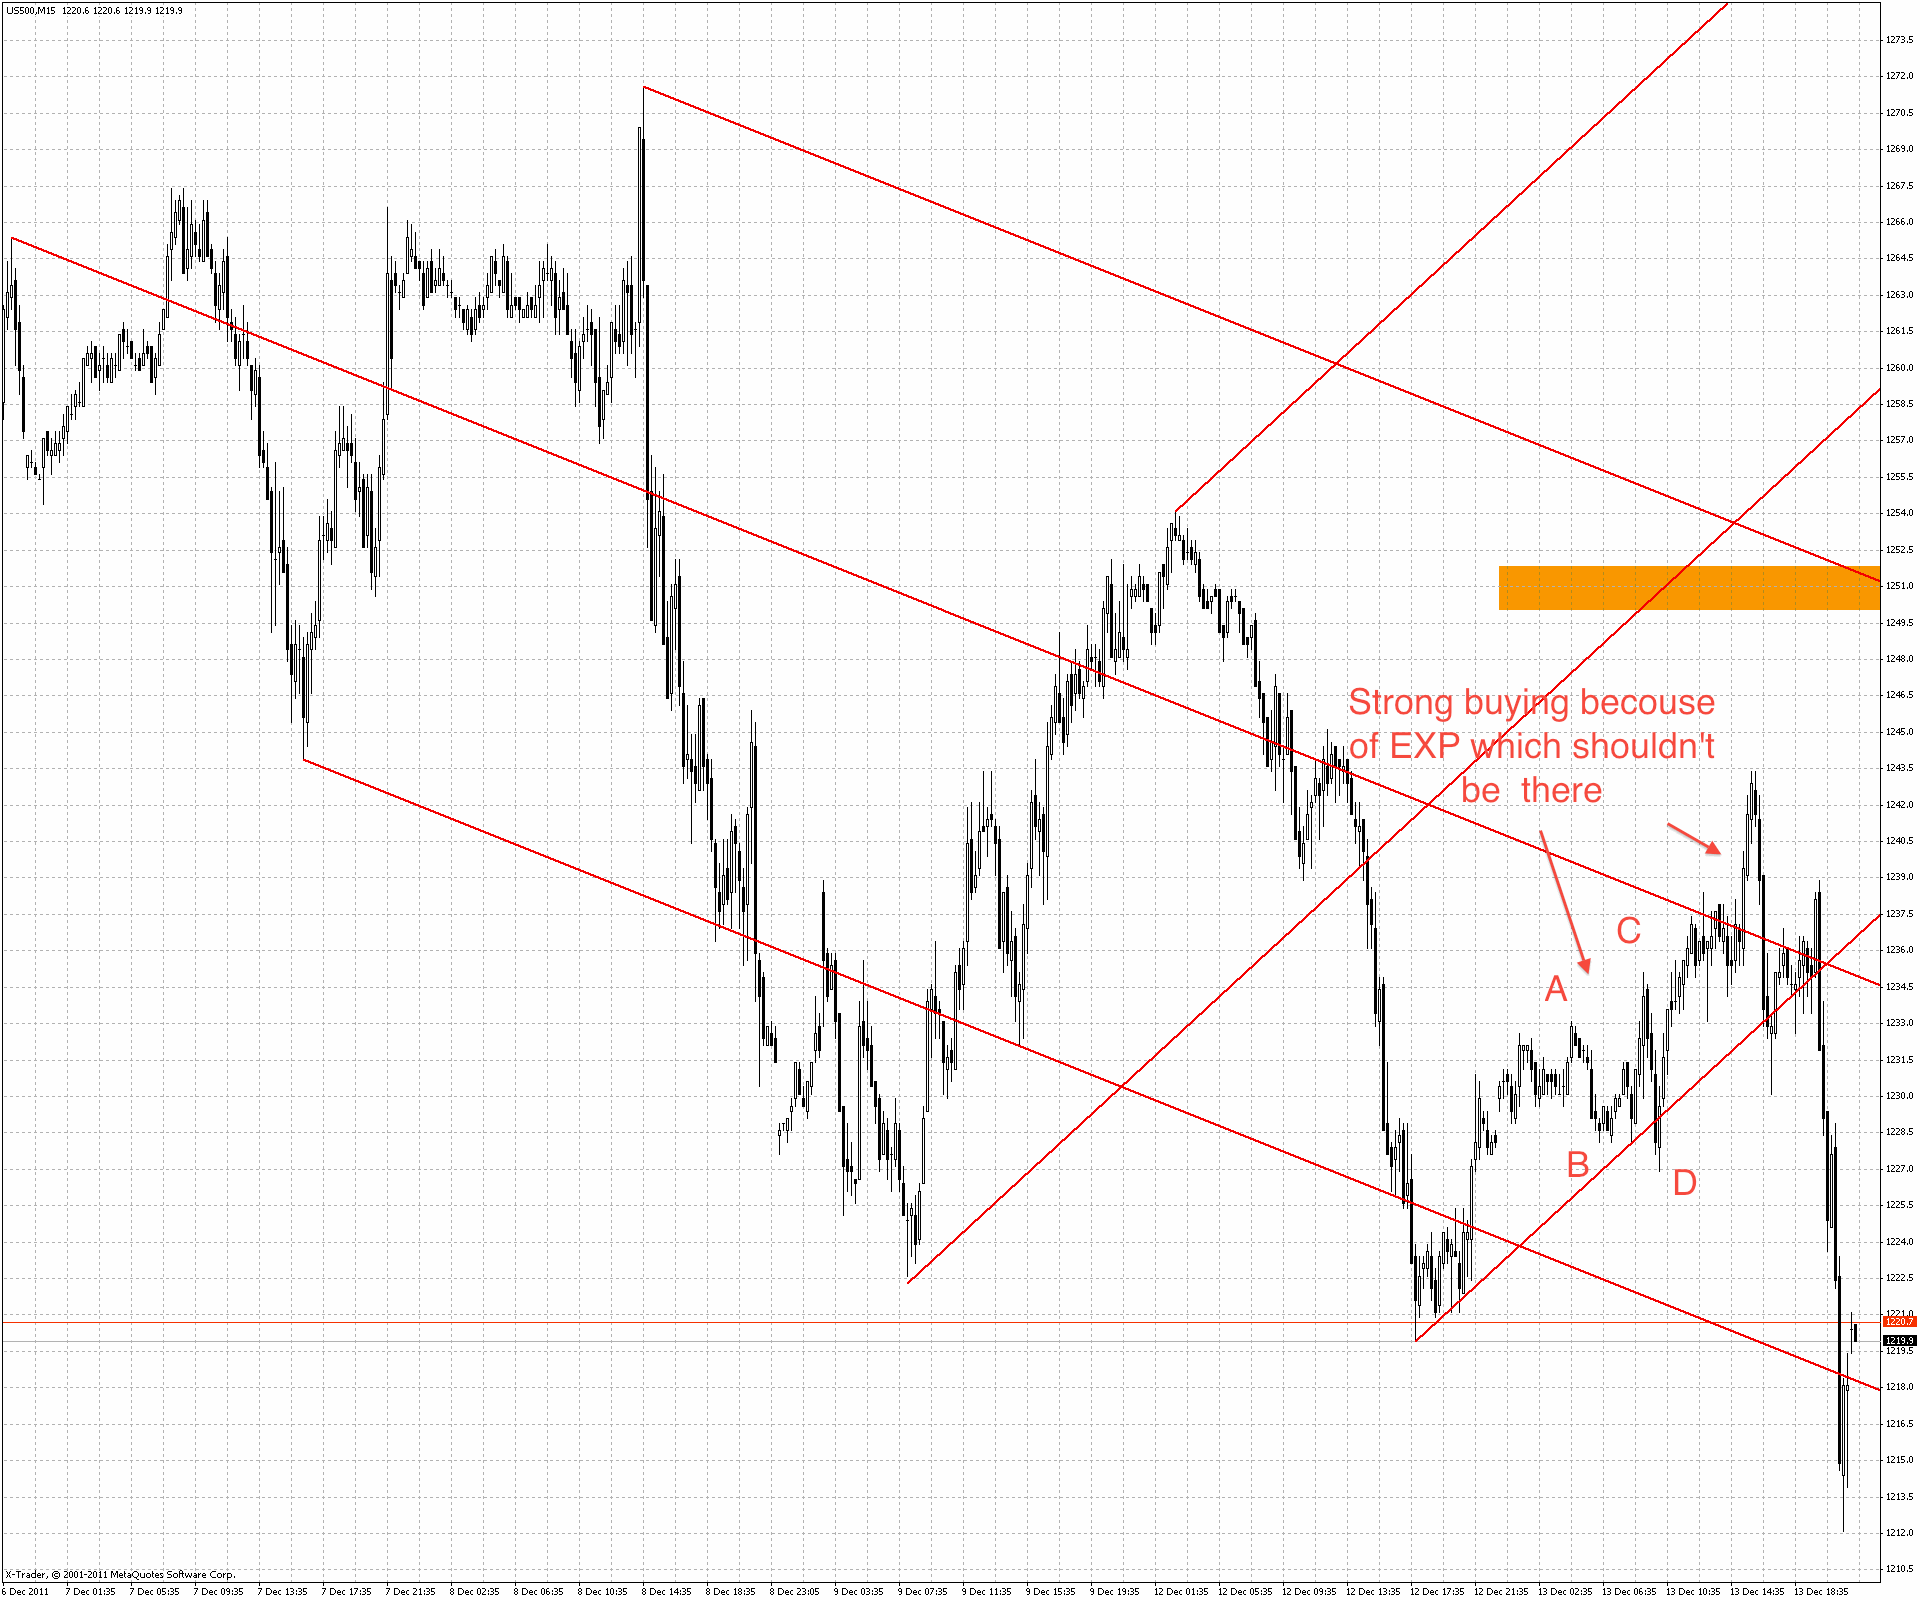
Here are charts.
Originally posted by jimkane
Can you post a labeled chart showing this? I'm not sure the readers will be able to follow you, or any discussion we do, without a visual to start.
Click image for original size
Click image for original size
JI
jimkane
Rep: 3,058
Posts: 33,089
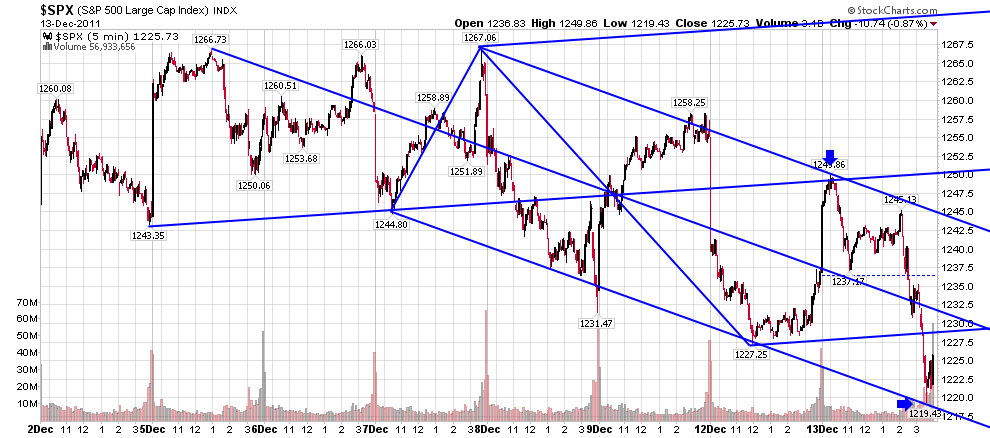
Now, you know how few charts I do. I don't want to appear to be trying to take away from roofer's beautiful chart, but I thought this was so amazing I wanted to clean up my chart and post it. All that roofer shows, the beautiful simplicity of it, that's spectacular. I am not showing this to overly complicate things, or to say more is needed (that's for each trader to decide for him or herself, what is needed). I have one reason for showing this: to demonstrate that I think there is more going on than meets the casual eye. The geometry flows through all the swings, from place to place.
I also had work on this index, and everyone knows how I like to go overboard. Why I kept going is because no matter where I put a set on, it kept hitting the same spot. I had no less that eight basic set lines coming together. This is without doing any of my adjusted sets, which I didn't even attempt to put on here. These are all natural sets off obvious swing points. Just look at that.
No, these are not all necessary to potentially construct a trade. That's not my point. My point is to show the incredible harmonicity and beauty in the price action. To show what is there but many, if not most, will miss in working up a chart like this. Trust me, there is a lot more hidden that isn't shown even here. It's all there, we just have to find it. And some say the markets are random... Enjoy (I hope).
Chart created on QCharts, courtesy eSignal
I also had work on this index, and everyone knows how I like to go overboard. Why I kept going is because no matter where I put a set on, it kept hitting the same spot. I had no less that eight basic set lines coming together. This is without doing any of my adjusted sets, which I didn't even attempt to put on here. These are all natural sets off obvious swing points. Just look at that.
No, these are not all necessary to potentially construct a trade. That's not my point. My point is to show the incredible harmonicity and beauty in the price action. To show what is there but many, if not most, will miss in working up a chart like this. Trust me, there is a lot more hidden that isn't shown even here. It's all there, we just have to find it. And some say the markets are random... Enjoy (I hope).
Click image for original size
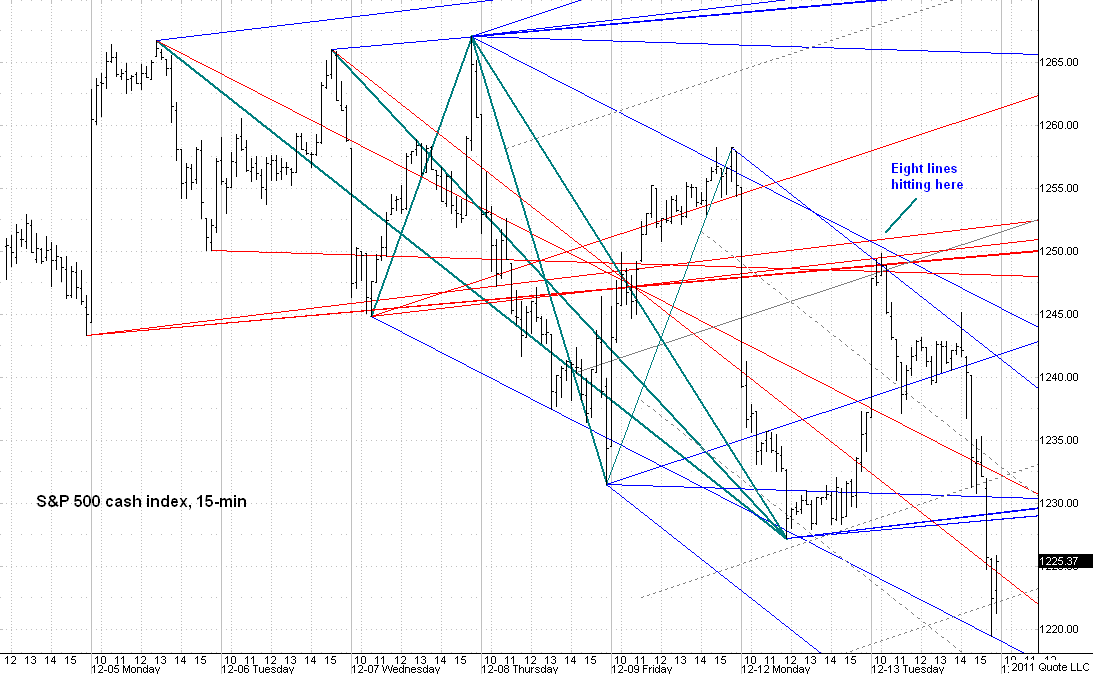
Chart created on QCharts, courtesy eSignal
JI
jimkane
Rep: 3,058
Posts: 33,089
ES 'on the move'. Up 13 now off the low. What was I saying about getting better prices and then the gov/TBTF will gun it up for the bonuses? We'll see. I can't imagine them not gunning this up by year end for bonuses...
SI
sirios
Rep: 0
Posts: 157
I also do not count Elliott waves, but I strongly analize what they draw in legs of potential W1, W2 (which can appear everywere) and market reaction on it. XA, AB, CD legs should be impulse waves BC leg should be corrective. I take this approach from your book "Multiple timeframe and Context", so this is a part of your methodology and that's why I was asking. I think I started understand what impulse mean and see sometimes big changes in market behavior when they do something small what change overall picture.
I do not have so much expirience as you have, so probably in long term it doesn't work, but I think I should use it until stop working.
I do not have so much expirience as you have, so probably in long term it doesn't work, but I think I should use it until stop working.
Originally posted by jimkane
Okay, nice charts. Now, forgive me, but can you ask me again what it is you are wondering? I think perhaps I am not as strict with Elliott as many think. I only use 'practical' Elliott, as it helps my trading. That's why I say a lot of things like 'behaves like a 'W2'' or 'To a typical 'W4' area', and things of that sort.
SI
sirios
Rep: 0
Posts: 157
Probably first they want to do CONT on daily chart.
Originally posted by jimkane
ES 'on the move'. Up 13 now off the low. What was I saying about getting better prices and then the gov/TBTF will gun it up for the bonuses? We'll see. I can't imagine them not gunning this up by year end for bonuses...
RA
rat89
Rep: 0
Posts: 7,015
roofer and jim - those charts are worth a thousand words - but having both together is spectacular.
one thing i constantly learn from roofer is to back out and look at a bigger picture. i've combined the two sets i was looking at and the two he shows. it is amazing how the price came together with time and fib at line just ahead of the fed. the tools often come together just in time for news to act as the cover.
one thing i constantly learn from roofer is to back out and look at a bigger picture. i've combined the two sets i was looking at and the two he shows. it is amazing how the price came together with time and fib at line just ahead of the fed. the tools often come together just in time for news to act as the cover.
Click image for original size