ES Friday 1-27-12
Here's what I've got for my ES MAP of PASR ZONES using a 30min chart of 20 days of data coming into Friday's trading. The Red lines are potential significant levels with Magenta lines as semi-significant. The White dashed lines are the Weekly Pivots (kind of a background thing to have on the chart). The Light Blue Volume Profile of the past "rolling" 20 days is displayed on the right vertical axis. Btw, price lines that are CLOSE together (within a couple of points), should be taken as an overall ZONE. The Gray background shows non-RTH price activity. Hope, as always, that this is helpful to some as a "MAP."
Click image for original size
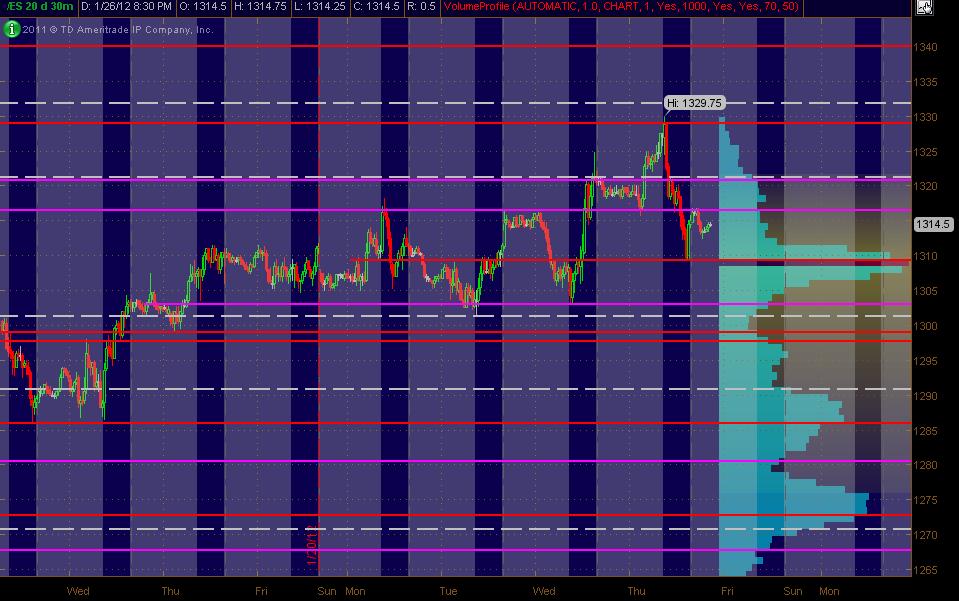
using 1311- 1313 ...as resistance...then 16.75...then 19.50 - 21 as a zone...
below is 1107.50...then 1103...biggest zone is 95 - 97.50...
good luck today
below is 1107.50...then 1103...biggest zone is 95 - 97.50...
good luck today
back to the weekly open...looking for signs to get short up here now in first key zone once the plus 4 has hit
that 4-5.5 zone worked very nicely today
perfect...now what to make of the weekly open.......will this be a doji on the weekly timeframe?
looking for sells again above the plus 4....."M" pattern
very cool how every 3 - 5 bars we have the change in direction...segment count in action...
this coil won't last forever.....!!
this coil won't last forever.....!!
60 minutes chart showing 1302.5 as a possible low for today
that looks like 8 lower lows and lower high swings on the 5 minute...I expect a higher low swing to form soon or a break of one of the highs above
these swings seem too obvious now..here is how they are labelled for me....in my mind...I numbered them for u ...so expecting higher trade...obviously that # 8 point needs to hold
Click image for original size
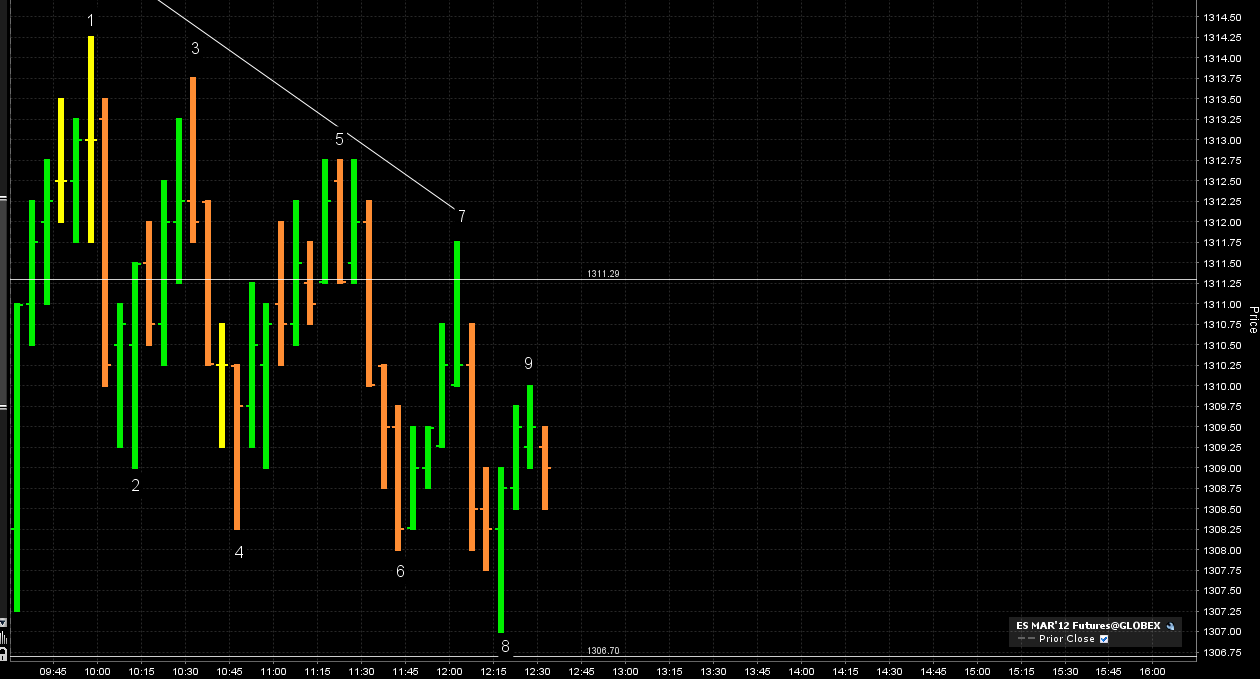
so if I am correct the smart money will be looking to buy on this drop off the triple high at 1310.50...then create the higher low before we make a new low...hopefully the footprint will show us SOMETHING to get long before #8 gets broken
Oh yeah, ya gotta score it yourself with some sweet guitar acoustic background soundscapes!
Emini Day Trading /
Daily Notes /
Forecast /
Economic Events /
Search /
Terms and Conditions /
Disclaimer /
Books /
Online Books /
Site Map /
Contact /
Privacy Policy /
Links /
About /
Day Trading Forum /
Investment Calculators /
Pivot Point Calculator /
Market Profile Generator /
Fibonacci Calculator /
Mailing List /
Advertise Here /
Articles /
Financial Terms /
Brokers /
Software /
Holidays /
Stock Split Calendar /
Mortgage Calculator /
Donate
Copyright © 2004-2023, MyPivots. All rights reserved.
Copyright © 2004-2023, MyPivots. All rights reserved.