ES Monday 2-6-12
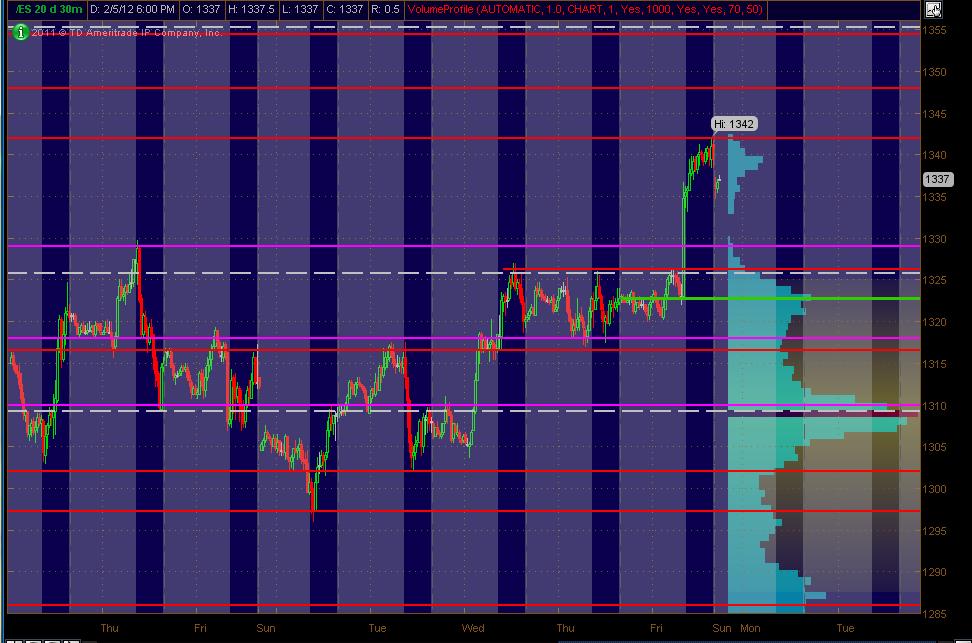
Here's what I've got for my ES MAP of PASR ZONES using a 30min chart of 20 days of data coming into Monday's trading. The Red lines are potential significant levels with Magenta lines as semi-significant. The Green line is the close on Thursday which is the GAP based on the opening on Friday (unclosed obviously). The White dashed lines are the Weekly Pivots (kind of a background thing to have on the chart). The Light Blue Volume Profile of the past "rolling" 20 days is displayed on the right vertical axis. Btw, price lines that are CLOSE together (within a couple of points of so), should be taken as an overall ZONE. The Gray background shows non-RTH price activity. Hope, as always, that this is helpful to some as a "MAP."
This spans roughly 100 ES points on the chart. More scattered lines than I'd like to have typically, but here's what I'm looking at as significant areas:
1354.50-1355.25 PASR / Wkly Pvt / .619 Fib Extension as per mypivots
1348 PASR / RTH Daily S2 / ATH Daily S1
1326 PASR / Wkly Pvt
(1322.75) gap close from Friday - the green line
1316.50-1318 PASR ZONE / DeMark Wkly S1
[The magenta line at 1329 is on the chart and worth mentioning ... but only in passing, as I don't see this as offering much support other than being the "beginning" of an overall BIGGER support ZONE, fwiw]
Click image for original size
This spans roughly 100 ES points on the chart. More scattered lines than I'd like to have typically, but here's what I'm looking at as significant areas:
1354.50-1355.25 PASR / Wkly Pvt / .619 Fib Extension as per mypivots
1348 PASR / RTH Daily S2 / ATH Daily S1
1326 PASR / Wkly Pvt
(1322.75) gap close from Friday - the green line
1316.50-1318 PASR ZONE / DeMark Wkly S1
[The magenta line at 1329 is on the chart and worth mentioning ... but only in passing, as I don't see this as offering much support other than being the "beginning" of an overall BIGGER support ZONE, fwiw]
I go market to enter and for most exits......sometimes when I have one or two runners left then I will ship in a stop loss order on my final piece and a target...especially when I don't want to ACTIVELY watch...
This isn't the best exit strategy on last part but it gets me away from watching every last squiggle on the charts and only happens when I have just worked a good campaign
This isn't the best exit strategy on last part but it gets me away from watching every last squiggle on the charts and only happens when I have just worked a good campaign
Click image for original size
Emini Day Trading /
Daily Notes /
Forecast /
Economic Events /
Search /
Terms and Conditions /
Disclaimer /
Books /
Online Books /
Site Map /
Contact /
Privacy Policy /
Links /
About /
Day Trading Forum /
Investment Calculators /
Pivot Point Calculator /
Market Profile Generator /
Fibonacci Calculator /
Mailing List /
Advertise Here /
Articles /
Financial Terms /
Brokers /
Software /
Holidays /
Stock Split Calendar /
Mortgage Calculator /
Donate
Copyright © 2004-2023, MyPivots. All rights reserved.
Copyright © 2004-2023, MyPivots. All rights reserved.