ES Thursday 2-23-2012
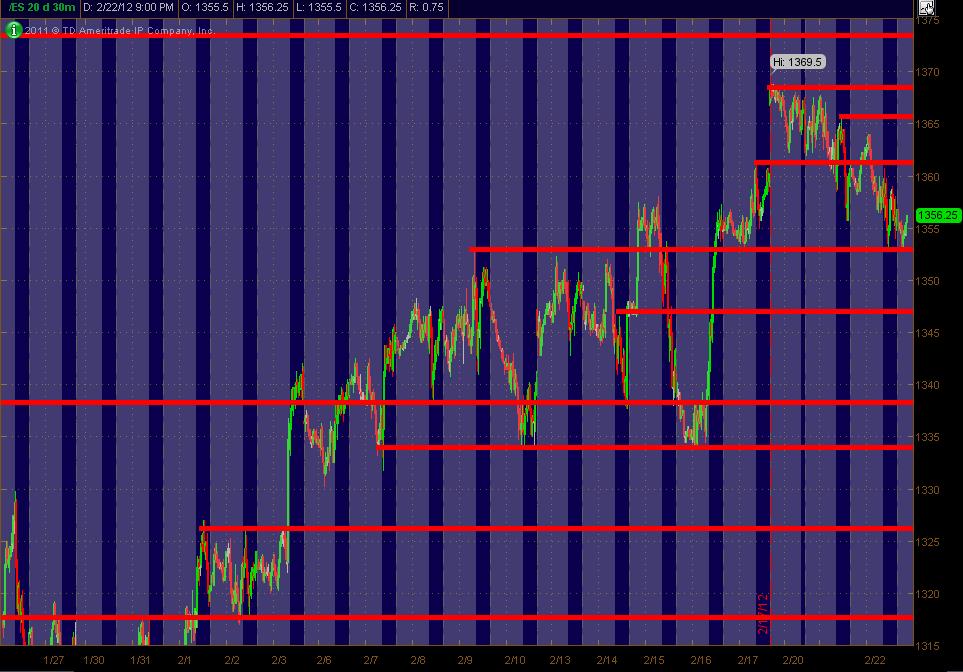
Here's just a slimmed down version showing only PASR ZONES using a 30min chart of the ES (All Trading Hours). The RTH's have the Blue background with the "overnight session" on a Gray background.
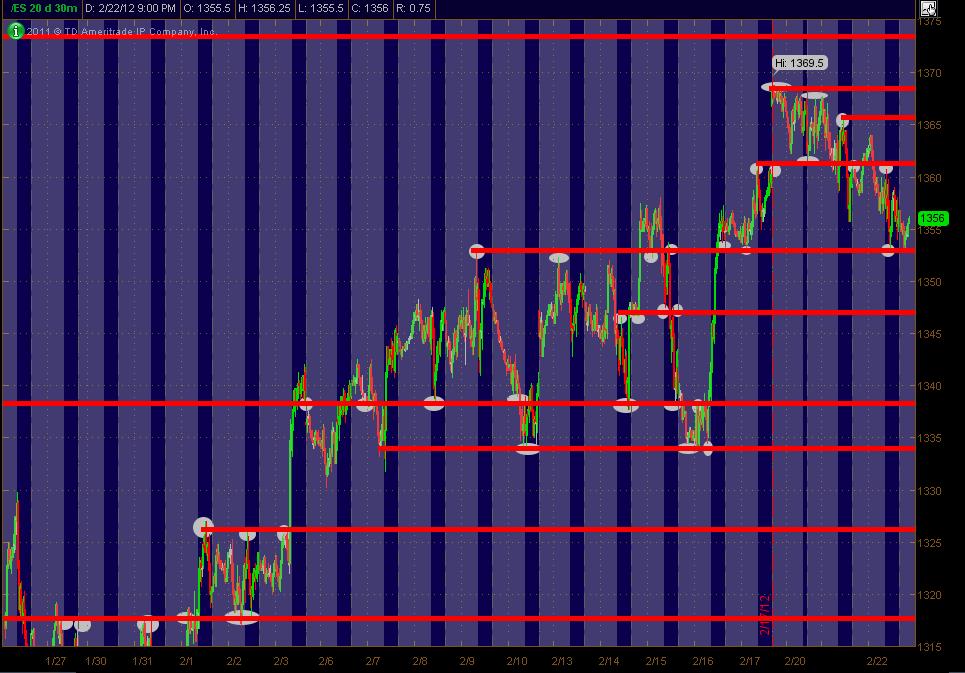
And here's what I was looking at to draw in the Red Zone PASR price levels. I've circled the past price action/swings etc. in White. Also, not shown, is higher and lower time frames I took into account in the same way (Daily chart ... less than 30min intraday etc.).
I stripped out my usual "background" dashed white lines showing Weekly Pivots and the Magenta "semi-significant" PASR's ... as well as removing the VolProf for a clean and simple chart.
Hope this is useful to some as a MAP of S/R levels where other components can be used for confluence ... Daily/Wkly Pivots and whatever else one finds useful ... and seeing the good ol' over-used word of "confluence."
MM
ps. FYI, these are ES continuous contract charts using Thinkorswim.
Click image for original size
And here's what I was looking at to draw in the Red Zone PASR price levels. I've circled the past price action/swings etc. in White. Also, not shown, is higher and lower time frames I took into account in the same way (Daily chart ... less than 30min intraday etc.).
I stripped out my usual "background" dashed white lines showing Weekly Pivots and the Magenta "semi-significant" PASR's ... as well as removing the VolProf for a clean and simple chart.
Click image for original size
Hope this is useful to some as a MAP of S/R levels where other components can be used for confluence ... Daily/Wkly Pivots and whatever else one finds useful ... and seeing the good ol' over-used word of "confluence."
MM
ps. FYI, these are ES continuous contract charts using Thinkorswim.
And just to loop-back-around to why I posted the above charts ... here's the link to the prior day's posts I did at the end of the topic/thread. It has more descriptions of how to find your own PASR's as well as addressing in an MS Word doc the walk-thru of where a pay-for-service does the same thing you can do yourself for, as I've said before, the price of a free movie ticket!
http://www.mypivots.com/board/topic/7276/-1/es-wednesday-2-22-2012
Hope all bang out some bucks on Thursday!
http://www.mypivots.com/board/topic/7276/-1/es-wednesday-2-22-2012
Hope all bang out some bucks on Thursday!
Thanks MM. Always appreciative of effort put into a quality post.
Emini Day Trading /
Daily Notes /
Forecast /
Economic Events /
Search /
Terms and Conditions /
Disclaimer /
Books /
Online Books /
Site Map /
Contact /
Privacy Policy /
Links /
About /
Day Trading Forum /
Investment Calculators /
Pivot Point Calculator /
Market Profile Generator /
Fibonacci Calculator /
Mailing List /
Advertise Here /
Articles /
Financial Terms /
Brokers /
Software /
Holidays /
Stock Split Calendar /
Mortgage Calculator /
Donate
Copyright © 2004-2023, MyPivots. All rights reserved.
Copyright © 2004-2023, MyPivots. All rights reserved.