ES Wednesday 2-22-2012
Click image for original size
I will email you
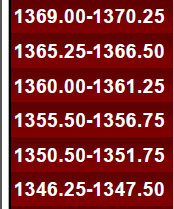
Looks like Pivotfarm to me.
If so, here's a way these types of price levels are determined - not rocket science. It's primarily just PASR type support resistance.
Here's a link that walks one thru how to find these levels (or zones). I reference to it as "scam" stuff from folks selling it ... probably shouldn't be so negative on it. It's just that it's pretty simple to do yourself.
Anyway, the s/r levels often appear to work more "effectively" in a market that's not overly volatile or trending intraday. Here's the link to a prior post of a MSWord doc blathering I did with some charts. Kind of enlightening. Forgive the grammar and spelling goofs (and the hatchet job vibe) ... I'd had a few brews the evening I banged it out.
http://www.mypivots.com/site/uf/20732/sr-trading-scam-services.doc
The Formerly Buzzed Monkey
u read my mind Monkey : i was gonna email u as I couldn't find that link...I had downloaded your document a few weeks back...It kicks butt and everyone should read it again and again...very well done indeed
We should have DT make that a sticky post and required reading somewhere too..
Bruce and MM
I agree with your assessment and I even subscribe to Pivotfarm. I have a hard time making use of the numbers I get on a daily basis. Some are important but others just confuse the average trader.
I'm not sure how long I will continue their service, when this site gives S/R numbers on a daily and weekly basis plus using the calculator works as well-all free. Thanks to MYPIVOTS.
Here's a couple of links on this site where I kind of explained how I find the PASR levels/zones ... like I said, pretty straightforward. Maybe this is helpful here for those wanting to be their own "price S/R service" for free.
http://www.mypivots.com/site/uf/12907/es-sr-30m-for-11011.jpg
http://www.mypivots.com/board/topic/5175/-1/support-resistance#5175
MM
http://www.mypivots.com/site/uf/12907/es-sr-30m-for-11011.jpg
http://www.mypivots.com/board/topic/5175/-1/support-resistance#5175
MM
And to add to this S/R going forward, I've posted 2 charts for tomorrow here:
http://www.mypivots.com/board/topic/7277/1/es-thursday-2-23-1012
The first shows the PASR Zones/levels ... the second shows how those levels were derived. Like I've said, it's pretty simple.
http://www.mypivots.com/board/topic/7277/1/es-thursday-2-23-1012
The first shows the PASR Zones/levels ... the second shows how those levels were derived. Like I've said, it's pretty simple.
Emini Day Trading /
Daily Notes /
Forecast /
Economic Events /
Search /
Terms and Conditions /
Disclaimer /
Books /
Online Books /
Site Map /
Contact /
Privacy Policy /
Links /
About /
Day Trading Forum /
Investment Calculators /
Pivot Point Calculator /
Market Profile Generator /
Fibonacci Calculator /
Mailing List /
Advertise Here /
Articles /
Financial Terms /
Brokers /
Software /
Holidays /
Stock Split Calendar /
Mortgage Calculator /
Donate
Copyright © 2004-2023, MyPivots. All rights reserved.
Copyright © 2004-2023, MyPivots. All rights reserved.