ES Thursday 3-8-12
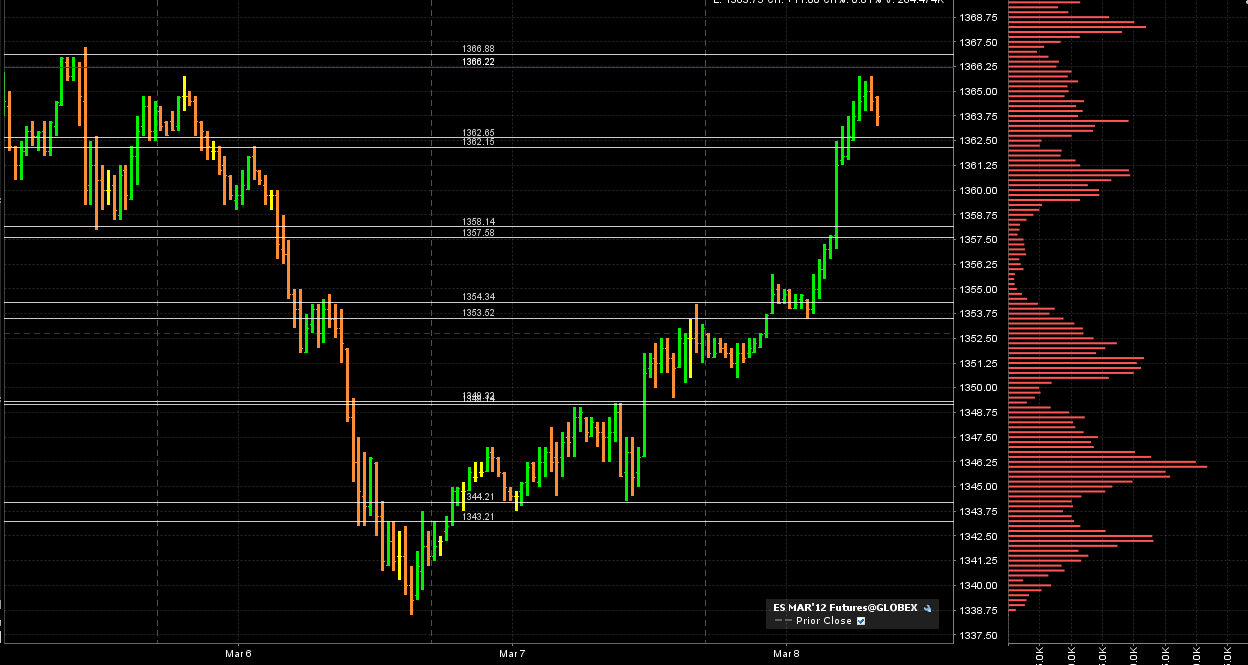
here is how my low volume numbers look on the down side. Above these I would be using 72 and 77 . Not shown. most interesting area is the BAND of low volume at 53.50 - 57.50.
We have a weekly open and weekly pivot at 1366. We have a daily r1 level at 56. Virgin VWAP at 69.25, 62.25, 50 and 44 ! Using March at least until noon
Once we get the 8:30 reports out of the way we can dial it down and as RTH opens we will have the completed O/N range to verify our numbers.
We have a weekly open and weekly pivot at 1366. We have a daily r1 level at 56. Virgin VWAP at 69.25, 62.25, 50 and 44 ! Using March at least until noon
Click image for original size
Once we get the 8:30 reports out of the way we can dial it down and as RTH opens we will have the completed O/N range to verify our numbers.
forming OVB 's on the weekly time frame happens about 4 % of the time but those stats may be slightly outdated. So since we already broke last weeks low we can at least THINK about the concept that we may not push out above last weeks highs at 77 this week based on probabilities.
Just pointing that out as I know many like the statistics of things.
Just pointing that out as I know many like the statistics of things.
my preference is to sell into a retest of 62 - 62.50. Will try buys but smaller at trade under 58.75.
gap in the data at 61 to torture us!
Bruce, when do you make the switch to June? How do you cross level data or do you just grab the new contract and go? I hate redrawing lines!
just went flat at 59.50..didn't like the mini air pocket above to hold longer and that is real close to my next buy zone
r2 is 60.25 today also!
r2 is 60.25 today also!
This afternoon. You can use the next contract June and use it's volume but I think it is better to see the differential and adjust with the march contract. So if I had a low volume area at 62.50 as per march then June is at 56.50 ..approximately and next key downside as per June is 6 points below our March key area so we can look at 51 - 52
Then compare that differential with what you see in Junes volume . it will still show Realtive low and high volume areas. Sometimes It helps to also wait and be more agressive on trades after we have traded in the new active month for a few day.
We get so much back and fill in the ES that it doesn't take long to set up just a few good areas above and below the market. I only trade the ES so I don't need to be concerned about redrawing lines too much but if you follow multiple markets then it could be a hassle.
Originally posted by G Runt
Bruce, when do you make the switch to June? How do you cross level data or do you just grab the new contract and go? I hate redrawing lines!
here is a concept that may help some hold longer term trades. We know that 10 point ranges seems to be the norm currently so use the low volume areas to help validate those long term targets.
simple logic : if the 62.50 is gonna be resistance then we can expect 52.50. But the 58 area is the deciding factor...will it become support and then we will move up into 1368 ? We will have to decide if 62.50 is going to cause us trouble on our projection for the way back up
we can monitor those low volume areas to try and fiqure out where the ultimate range will unfold today
57.5 was the breakout point in the overnight session...has held the test so far
Click image for original size
lots of stops sitting above 59.50..trying to find longs in the 57.50 down to 56 area to go back up to get them..will take multiple small tries down here as that 62.50 could be the high for today and don't want to be agressive against that
Thanks Jedi.
Emini Day Trading /
Daily Notes /
Forecast /
Economic Events /
Search /
Terms and Conditions /
Disclaimer /
Books /
Online Books /
Site Map /
Contact /
Privacy Policy /
Links /
About /
Day Trading Forum /
Investment Calculators /
Pivot Point Calculator /
Market Profile Generator /
Fibonacci Calculator /
Mailing List /
Advertise Here /
Articles /
Financial Terms /
Brokers /
Software /
Holidays /
Stock Split Calendar /
Mortgage Calculator /
Donate
Copyright © 2004-2023, MyPivots. All rights reserved.
Copyright © 2004-2023, MyPivots. All rights reserved.