ES Monday August 6th
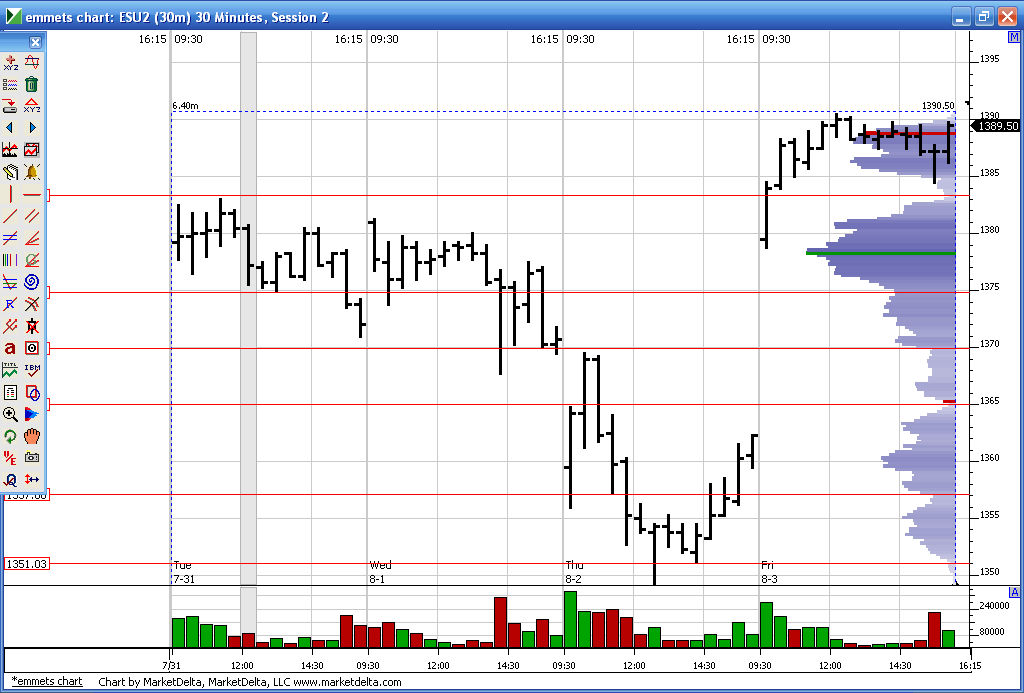
Current O/N low falls at the cleavage point from Fridays session so
1387 is a key area today and I think they will fill that in RTH. Also the 4 pm volume was there Friday. My bias is to the short side above Fridays RTH high to get that 1387.
Other numbers: 1390 - 1391.50 = Fridays high and peak volume from the O/N session
1383 - 1384.50 = ****The afternoon pullback low and the high volume bars that went untested on Friday.. First critical support point.
1377 - 1378 = old untested Vpoc and poc
Besides the obvious range extremes we need to watch the 1373 - 1375 *****area closely...this is where the report volume came in on friday in the O/N session and buyers won from that point. so what happens when we come back to test it ? It's also the midpoint between Thursdays High and fridays low !!
all the critical areas have about 10 points between them so you can see where the O/N high sits and add 10 points from 1383 - 1384. A further rally will try to push above 1400 mark into 1403 - 1404 but I don't expect that today.
1369 - 1371 has an LVN and a unfilled gap close along with Thursdays high!!
Another key area below is 1364 - 1365
here is a quick chart for some to see the key areas..
Click image for original size
Thanks for the explanations of the numbers
...and the chart
A picture's worth a thousand words.
...and the chart
A picture's worth a thousand words.
92.75 is now the volume magnet....safer trade is to wait until 3 -4 points prints on the upside if you want to sell up here.....it has already gone 3 points up to 95.25 !
I am selling into 94.75 and will add higher if needed
I am selling into 94.75 and will add higher if needed
low volume sits right above the open print to target and help pullit back down
that double top isn't giving me great confidence on this fade and we tested the 92.75 volume...
I am prepared for trade to pop outside the IB high to run out the double top but will still maintain the short bias
I am prepared for trade to pop outside the IB high to run out the double top but will still maintain the short bias
new big volume at 95.....so will sell under that node again.....they will push to 98 - 99 if we are wrong on direction or else we will get back to our 92.75 and lower to that 91.50 low volume
hopefully this failure to break the iB high is the only test of the IB and we keep dropping for the 3- 4 points down to targets mentioned...still tuff trade either way
on Friday we ended up with the "P" pattern which sometimes implies a market struggling to go higher...most of fridays gains happened in the O/N session...today we are forming another "P" pattern and I'm thinking that the buyers may be tired
so far today only two areas have really interested traders : the break of the O/N high and the break from the IB high....hoping the 11 - 11:30 time frame does something exciting
these kinda ranges and trading can make ya old quick !!! If they can't generate business at one volume area they will come back to a place where they can generate volume....hence the saying "Price is attracted to volume"
now most people live and trade and fail by looking at just volume that is generated over TIME that builds up...traditional VPOC usually falls into that category.......I suggest looking at both as LVN's are often generated by high volume from the vertical scale..in other words LVn's are generated by big volume that enters the market and THEN everybody piles on to follow the lead of the big players...this helps the big players drive price away leaving LVN's behind
today we had big volume come in at 92.75 and 95 even...compare the two ..one volume node keeps attracting price - the 95 and nobody has won the battle yet...now look at how there is an LVN AREA at the 92.75...two different formations but both happened because big volume entered nearby
how often are we coming back to test the 95 volume ? quite often....how often have we tested the 92.75 ? only once
what are we suppose to try and hold all day ?? ridiculous!!
Emini Day Trading /
Daily Notes /
Forecast /
Economic Events /
Search /
Terms and Conditions /
Disclaimer /
Books /
Online Books /
Site Map /
Contact /
Privacy Policy /
Links /
About /
Day Trading Forum /
Investment Calculators /
Pivot Point Calculator /
Market Profile Generator /
Fibonacci Calculator /
Mailing List /
Advertise Here /
Articles /
Financial Terms /
Brokers /
Software /
Holidays /
Stock Split Calendar /
Mortgage Calculator /
Donate
Copyright © 2004-2023, MyPivots. All rights reserved.
Copyright © 2004-2023, MyPivots. All rights reserved.