ES Tues 9-25-12
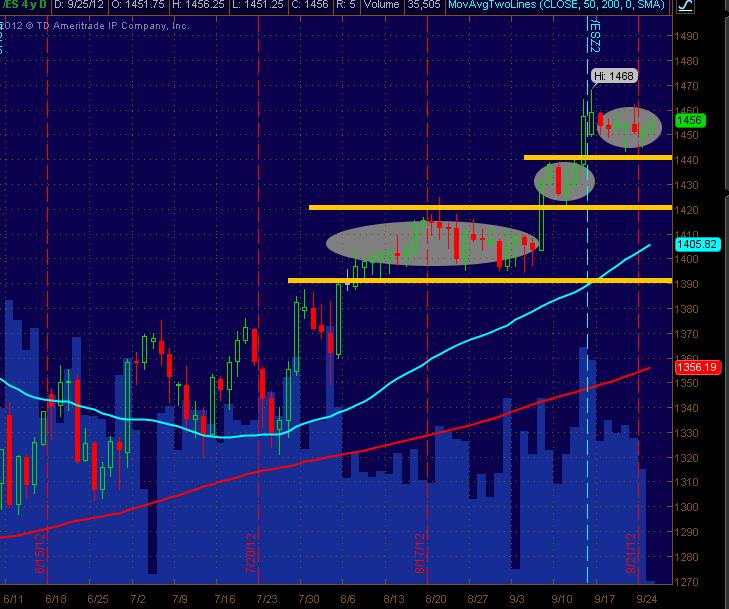
Here's my Daily (continuous contract) chart where it shows a stair stepping upwards appearance on the chart. A number of days comprising sideways (resting?) action with a day or two that spikes out of it. Currently, it's in the sideways/consolidating phase. Lotta folks could say overbought on intermediate and even on short term price action. But, this is the current MODE of the market and, for now, would expect another spike type of move out of the area price is now inhabiting. The longer, the bigger magnitude likely (up or down) ... but the trend is UP.
Here's my visual of how I see the ES Daily.
Yellow lines would be likely support levels if mkt moves down.
JUST TOSSING THIS OUT SINCE THE SITE HERE AIN'T HAD MUCH POSTINGS LATELY (Bruce and others ... y'all backsliding?!?)
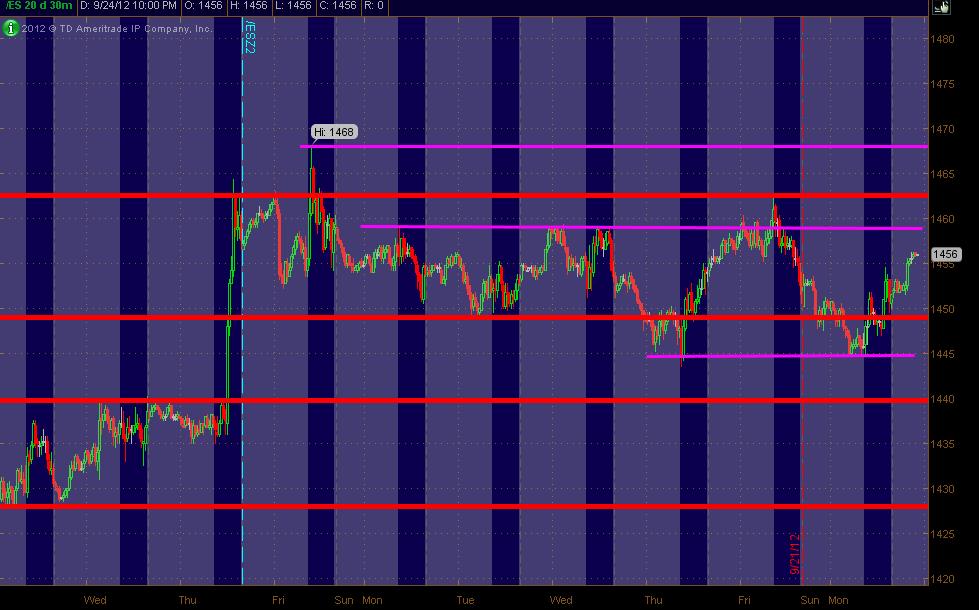
The following chart is my typical MAP of PASR levels on the 30min ES.
Here's my visual of how I see the ES Daily.
Click image for original size
Yellow lines would be likely support levels if mkt moves down.
JUST TOSSING THIS OUT SINCE THE SITE HERE AIN'T HAD MUCH POSTINGS LATELY (Bruce and others ... y'all backsliding?!?)
The following chart is my typical MAP of PASR levels on the 30min ES.
So here's my ES 30min with PASR levels drawn in ... Red as potentially significant and Magenta as semi-significant. Also, have listed the price levels along with Daily and Weekly corresponding Pivot price levels as per mypivots.
1468 SR / Dly R3 area
1462.50 SR / Dly R2 area / Wkly R1 area
1459 SR
1449 SR / Dly Mid Pvt area
1444.75 SR / Wkly S1 area
1439.75 SR / Dly S2 area
As always, this is just a map of potential PASR ZONES to work off of as a MAP of the ES coming into the next day or few. Hope it's helpful to folks!
Click image for original size
1468 SR / Dly R3 area
1462.50 SR / Dly R2 area / Wkly R1 area
1459 SR
1449 SR / Dly Mid Pvt area
1444.75 SR / Wkly S1 area
1439.75 SR / Dly S2 area
As always, this is just a map of potential PASR ZONES to work off of as a MAP of the ES coming into the next day or few. Hope it's helpful to folks!
Two key #s for me are 1452.25 and 1459.75 .. 1459.75 is a key # from yesterday .. 1452.25 was made last ...
I always look for the mid point of any zone to be an area of importance .. if price is above/below determine weather it is a sell or buy area .. the mid today is sell for now .. but a break through would put 1459.75 on the radar ..
Why did all of Bruce's comments from today dissapeared?
Originally posted by apk781
Why did all of Bruce's comments from today dissapeared?
Yeah, whazzup wit dat?
wuz wunderin' the same thang ... maybe went into stealth posting mode with invisible digital pixil ink - dunno
(or maybe "Bruce" has been an AI computer program all along and accidentally erased himself today)
(or maybe "Bruce" has been an AI computer program all along and accidentally erased himself today)
nice to see u back bruce after yest weird dissapearing act lol
in any case, i think 19.5-21.5 has a good chance to get tested and i would be a buyer at both edges of that range
above we have created a lvn in the 28.75-30.25 area and i guess bears need to defend that if my lower target is to be seen today
in any case, i think 19.5-21.5 has a good chance to get tested and i would be a buyer at both edges of that range
above we have created a lvn in the 28.75-30.25 area and i guess bears need to defend that if my lower target is to be seen today
thanks Nick..I gotta start a new thread and will copy today stuff there later..I want to see 30.75 print still....
we have key specific numbers below at 27 and 25 even...hope they are done with those but just not sure now that lunchtime is here
we have key specific numbers below at 27 and 25 even...hope they are done with those but just not sure now that lunchtime is here
Noticed how the market reverses at the "D" period on a 30 min TPO chart. This is the European markets closing time as well. This happened yesterday and today so far. Just an observation..
VWAP around 1431 or so seems to be containing this move up so far.
@ 6pm edt open I am watching 1432.25 pivot (9/26)
Emini Day Trading /
Daily Notes /
Forecast /
Economic Events /
Search /
Terms and Conditions /
Disclaimer /
Books /
Online Books /
Site Map /
Contact /
Privacy Policy /
Links /
About /
Day Trading Forum /
Investment Calculators /
Pivot Point Calculator /
Market Profile Generator /
Fibonacci Calculator /
Mailing List /
Advertise Here /
Articles /
Financial Terms /
Brokers /
Software /
Holidays /
Stock Split Calendar /
Mortgage Calculator /
Donate
Copyright © 2004-2023, MyPivots. All rights reserved.
Copyright © 2004-2023, MyPivots. All rights reserved.