ES Tues 9-25-12
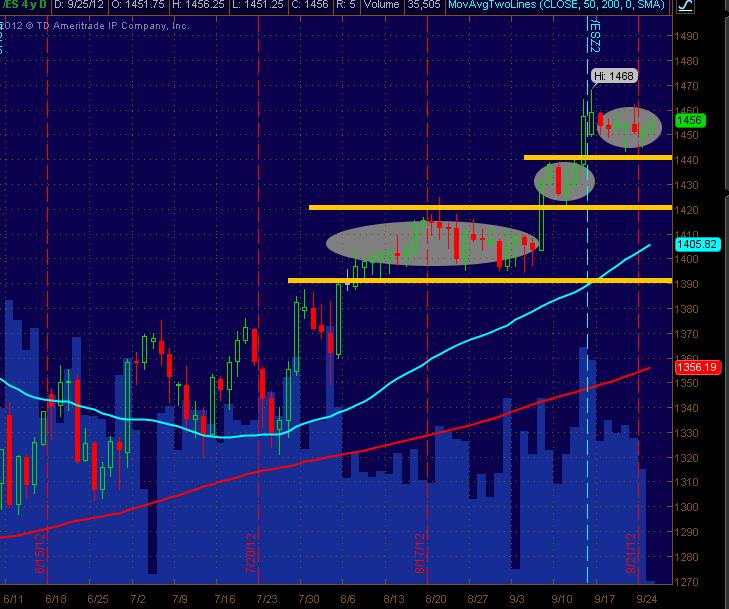
Here's my Daily (continuous contract) chart where it shows a stair stepping upwards appearance on the chart. A number of days comprising sideways (resting?) action with a day or two that spikes out of it. Currently, it's in the sideways/consolidating phase. Lotta folks could say overbought on intermediate and even on short term price action. But, this is the current MODE of the market and, for now, would expect another spike type of move out of the area price is now inhabiting. The longer, the bigger magnitude likely (up or down) ... but the trend is UP.
Here's my visual of how I see the ES Daily.
Yellow lines would be likely support levels if mkt moves down.
JUST TOSSING THIS OUT SINCE THE SITE HERE AIN'T HAD MUCH POSTINGS LATELY (Bruce and others ... y'all backsliding?!?)
The following chart is my typical MAP of PASR levels on the 30min ES.
Here's my visual of how I see the ES Daily.
Click image for original size
Yellow lines would be likely support levels if mkt moves down.
JUST TOSSING THIS OUT SINCE THE SITE HERE AIN'T HAD MUCH POSTINGS LATELY (Bruce and others ... y'all backsliding?!?)
The following chart is my typical MAP of PASR levels on the 30min ES.
Not sure if 31 is resistance or support, prices dancing on either side. VWAP and daily POC, I guess thats value for now.
@ 6pm edt open I am watching 1432.25 pivot (9/26)
Emini Day Trading /
Daily Notes /
Forecast /
Economic Events /
Search /
Terms and Conditions /
Disclaimer /
Books /
Online Books /
Site Map /
Contact /
Privacy Policy /
Links /
About /
Day Trading Forum /
Investment Calculators /
Pivot Point Calculator /
Market Profile Generator /
Fibonacci Calculator /
Mailing List /
Advertise Here /
Articles /
Financial Terms /
Brokers /
Software /
Holidays /
Stock Split Calendar /
Mortgage Calculator /
Donate
Copyright © 2004-2023, MyPivots. All rights reserved.
Copyright © 2004-2023, MyPivots. All rights reserved.