MyPivots
Sign In
MA
MarcinO
Rep: 67
Posts: 5,506
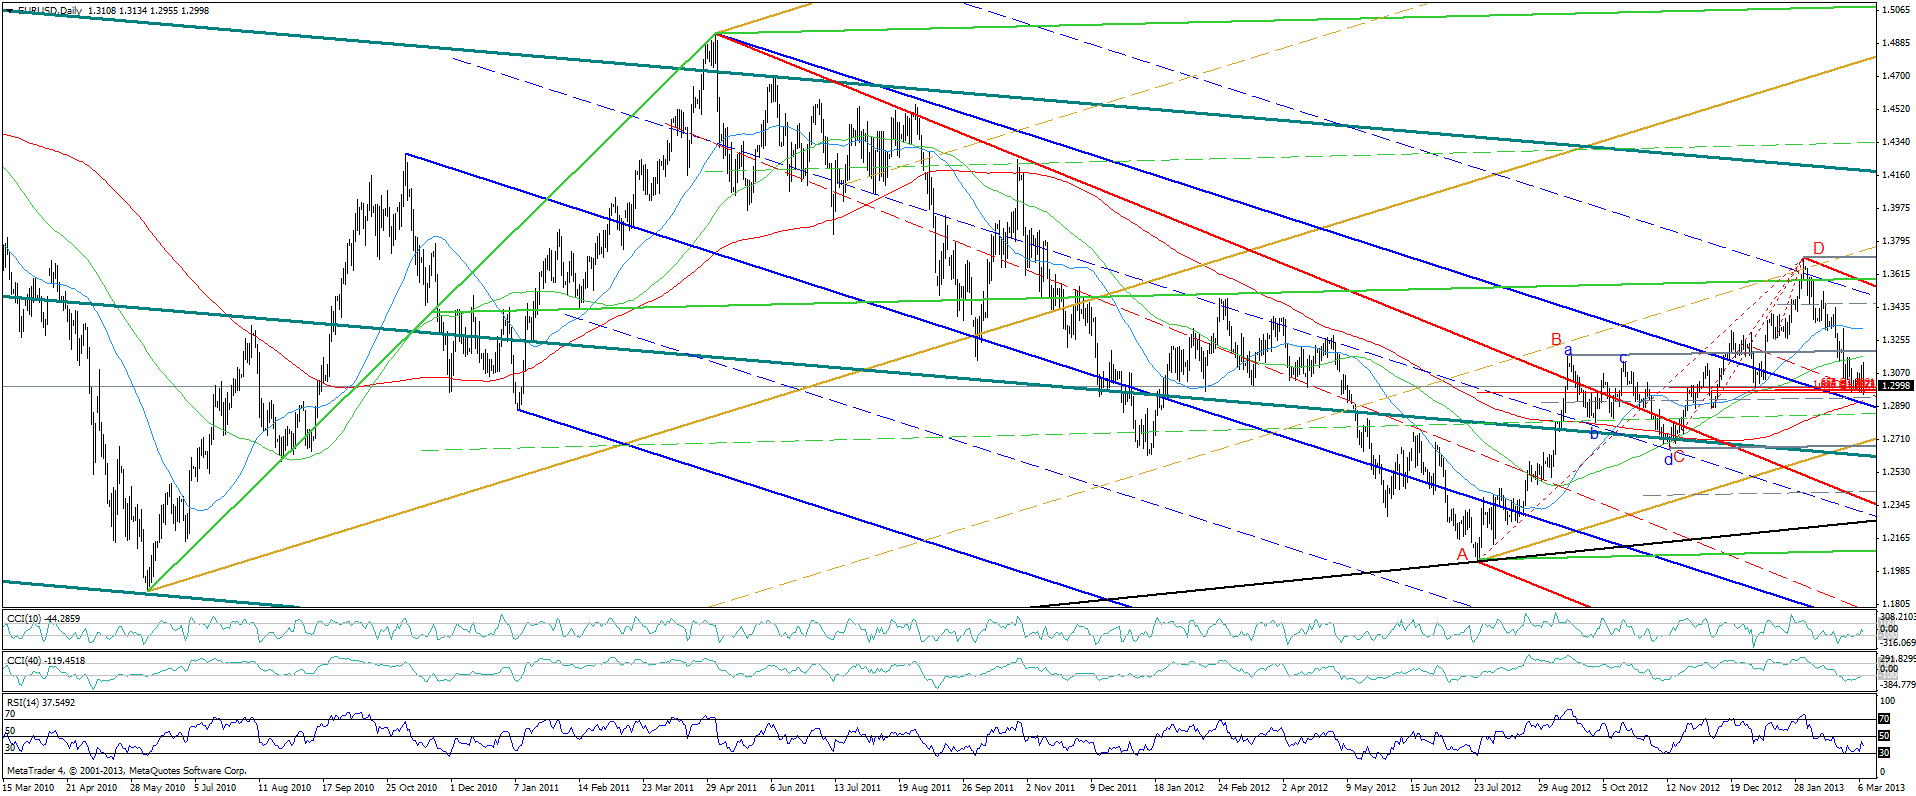
Euro is struggling with .447 of the bearish ABCD, but given the 200 days MA and lines slightly beneath the area, even it fails range trading may be expected similar to the one near the C point.

Click image for original size
JI
jimkane
Rep: 3,058
Posts: 33,089
Oh, BTW, there's the new 'bulls#%&' market high. They think they are playing with kids here. Think again.
JI
jimkane
Rep: 3,058
Posts: 33,089
Everyone may want to 'hang around' for a little while. I'm working on that post I mentioned, complete with charts. It should be posted not too long from now. It will be a 'longer-term' post.
JI
jimkane
Rep: 3,058
Posts: 33,089
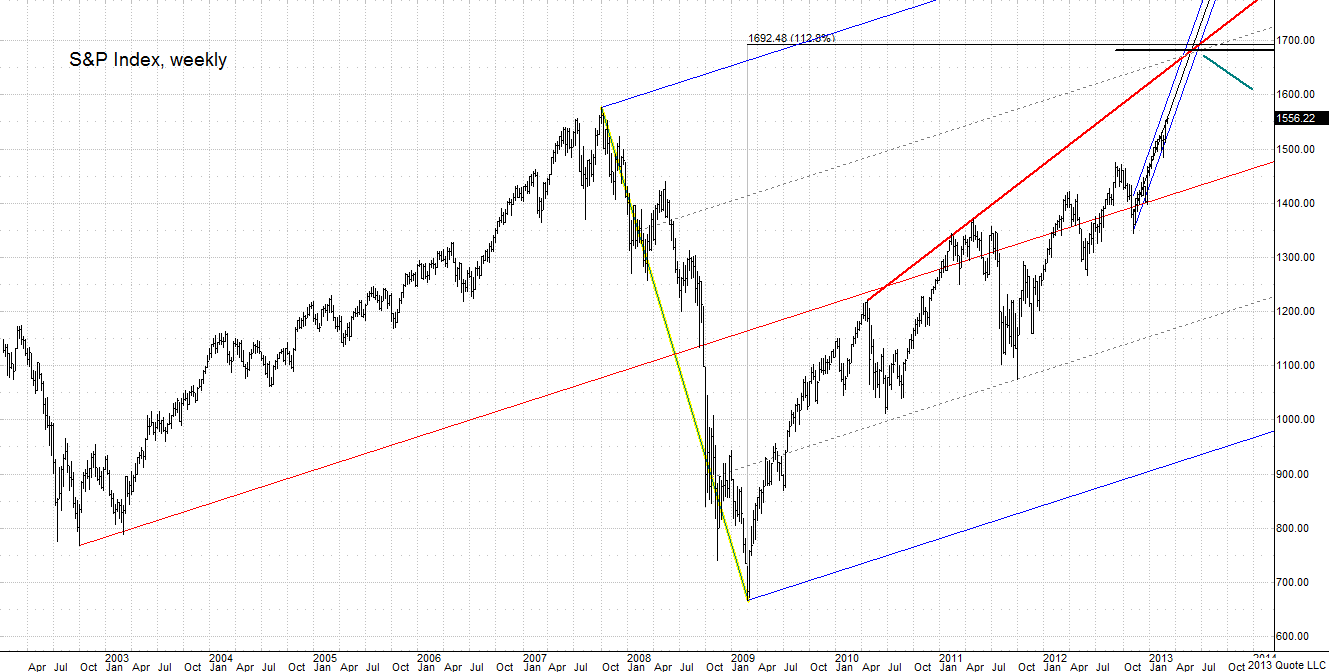
Okay, so, what do I think is perhaps unfolding on the higher timeframes? I was pondering how the greatest number of people could get fooled. There is the 1546 (to up to maybe forty points higher) crowd, then maybe a 10% 'correction', then off to the races. And the monster bulls, they are saying the bull might end (wow, can you imagine that?) end of this year or beginning of 2014. Of course when that time comes you know they will all extend it because the 'bull' is so strong, and the economy recovering so profoundly. Anyway, I thought maybe both groups would have to be proven wrong. You know, fool the greatest number of people, and all.

So, I was thinking what if the 'bull' ended in the summer? What if we went up in the same grind we did starting in January, and did this until the summer, then some 'news' hit and that was that. The first group would be trying to short it, or would be left behind, and the big 'bulls' waiting on the year end would get slaughtered, hanging on way too long. It makes sense, enough so that I wanted to see if anything technical supported that possible premise. I was playing with the S&P index and saw this.


Click image for original size
SP500_ 031113_Weekly1 chart


This hits in the May or June time period. Recall end of April into May has been the time of the 'big' corrections for this every year since the manipulation bottom started. So, last year was a bit of a disappointment. Maybe many are expecting this year will be much better. Hence, if it pushed on a bit past that time period, setting new 'bulls#%&' market highs (or all-time highs) nearly daily, those bears would give up, and the 'bulls' would really be emboldened. Then they crush them. It is one scenario I am looking at.

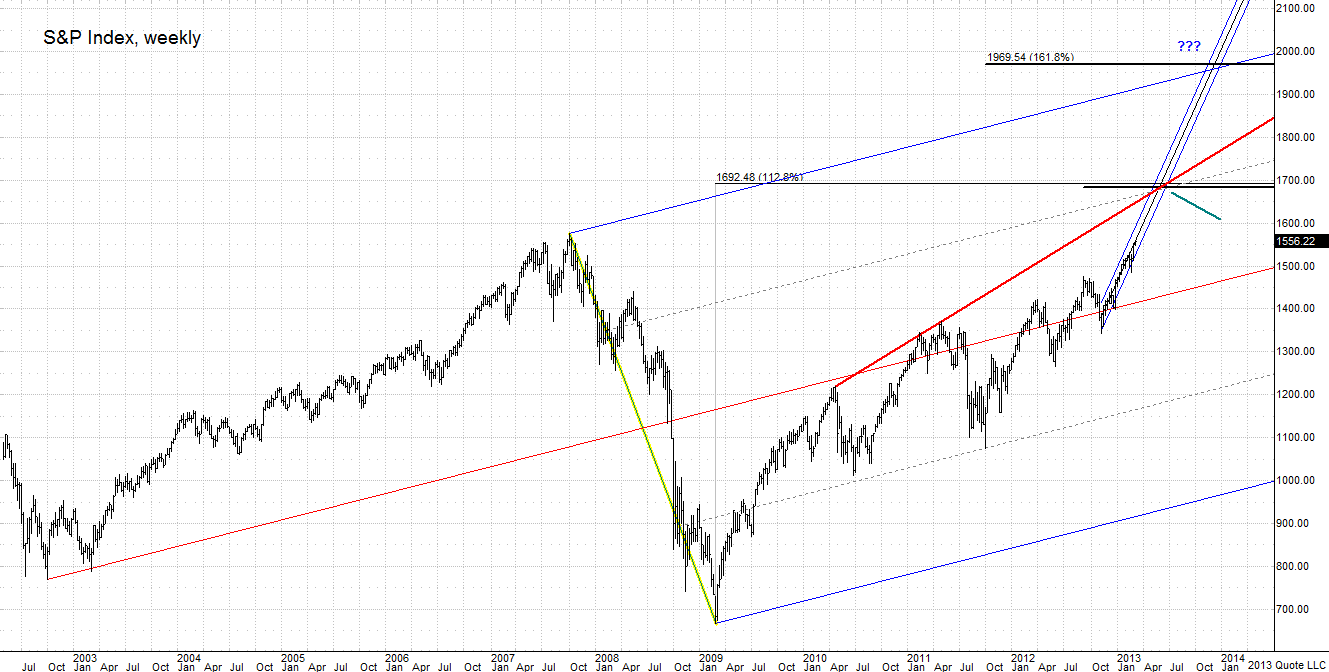
Now, as I studied the chart, I saw something else. One maniac on the idiot box was saying S&P 2000 by year end! By year end!!! I laughed. But look at this chart. Look at the level, and the time. It's exactly what the madman said. Could they grind it nonstop for basically an entire year, no real corrections, relentlessly grind it up? With Bern-qwacke putting in almost a trillion this year, doing POMO on almost every single day of the year? And if things weaken he may do even more. My answer is yes, yes they can (BTW, look at the first year off the '09 low...). Then the bull ends, in a blaze of glory. It isn't impossible. I feel like I may throw up...


Click image for original size
SP500_ 031113_Weekly2 chart


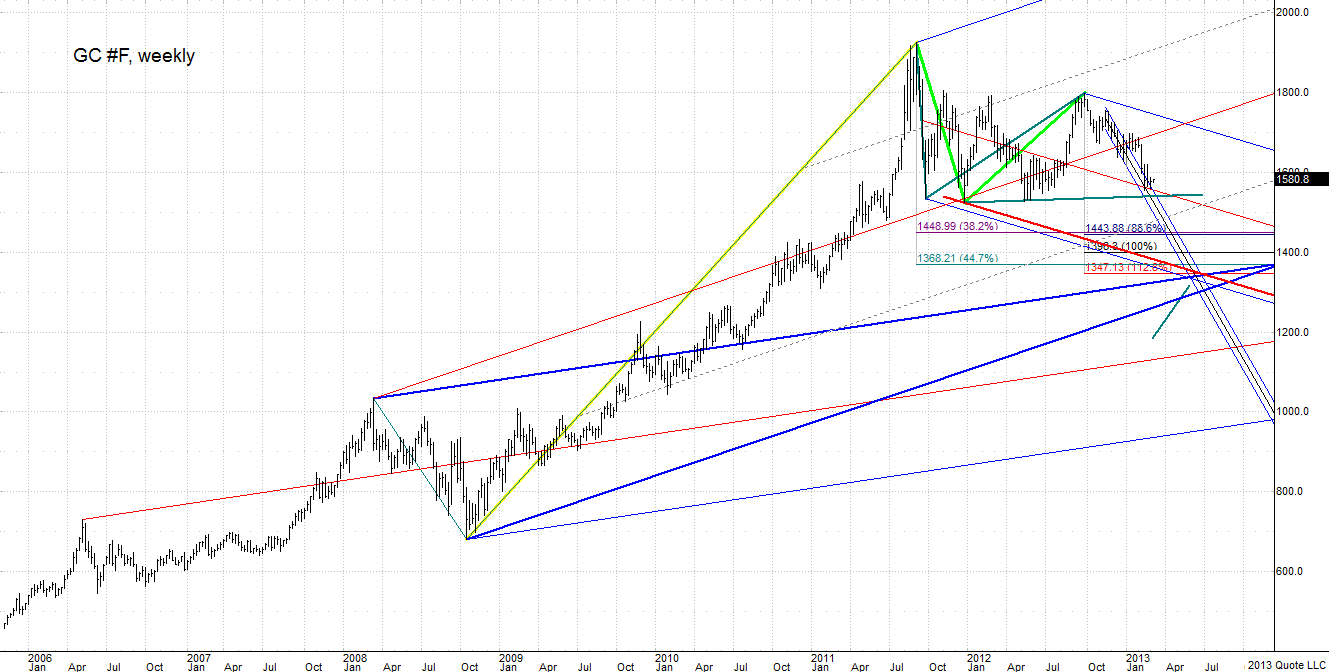
The 1.618 line is the ratio comparing this leg to that first year leg. Now, back to the more realistic first scenario. I was working up gold, and here's an abbreviated look at that.


Click image for original size
GC #F_031113_weekly chart


Notice the highlighted area, and the timeframe. (Yes, I know, gold going down that much, it seems impossible. On the other hand, I read recently how India, where more private gold is held than anywhere else in the world, may 'crack down' on private ownership. If so, gold could dump huge.) It completes an ABCD right at the same time the S&P hits that first area. Very curious. Now, I have a lot more coming together that I haven't shown, the same as the framework S&P charts. And there is an analogous GC area for that upper S&P area, too, sub-1000 (if India does something...). As an aside, do the obvious TL on GC, and go to log scale. It hits the highlighted area just about dead on.

Anyway, I am really wondering if one or both of these S&P scenarios may unfold. Take a look at a daily CMG chart (the area should be obvious) if you don't think they can do a long manipulation grind like I am saying. There seems to be no limit to what they can do. Just some thoughts from the world's biggest 'I want a bear market' guy there is.


Charts created on QCharts, courtesy eSignal
JI
jimkane
Rep: 3,058
Posts: 33,089
Okay, how's that Duane? I'm sure you wanted short-term charts, but this will have to do.
JI
jimkane
Rep: 3,058
Posts: 33,089
As an aside, this would bring GOOG well over 1,000, and I think that would be 'necessary' to end the 'bull.
JI
jimkane
Rep: 3,058
Posts: 33,089
Hmmm, does this make sense at new 'bull' market highs, and new all-time highs for many indices/sectors?

http://www.zerohedge.com/news/2013-03-11/nyse-matched-volume-drops-new-decade-low-february
JI
jimkane
Rep: 3,058
Posts: 33,089
Our whole world is balanced on the point of a knife, as it were. Any day the triggering event will take place. Then it's game over. This whole thing, the illusion, the propaganda, the lies, it's all so comical (in a sick, twisted way). And people buy right into it. The markets at all-time highs, things are good. Housing has recovered, jobs are really picking up. Yeah, right.

Before I post the link, let me mention something else that is perhaps the weirdest thing I have seen since all this started. I have read many very good articles that show energy is going to be a real problem going forward ('peak oil' or not). Fracking is a joke, not only is it incredibly environmentally dangerous (we have no idea what doing this could do, just like Fukushima), it isn't very resource efficient. And the savior of all mankind, oil shale? I have heard something like it takes 1.2 barrels of oil to extract one barrel of oil. Don't quote me on that, but I heard it's net negative.

With all that said, lately the main-stream media has picked up the story that by 2017, just four years from now, we will exceed Saudi Arabia and Russia in oil production! We will be the number one producer in the world! Our production has went 'hockey stick' on the chart! Soon after we will be energy independent, and net oil exporters! And with this, the dollar will surge! I went I don't know how many pages deep on Google, and every article was essentially a clone, and every link was for a main-stream media source. Not one contrary blog entry anywhere. I think this is totally a manipulation.

I have no idea what is going on, but to me this is utter nonsense. Oh, and I also forgot to mention, this prediction of energy independence is also based on the demand in the U.S. dropping substantially. Wait, why isn't that causing a panic? How can that be? That would imply ongoing severe recession or depression. Again, I have no idea what is behind this blast campaign, but it's really strange, and all the big players are in on it. Something is brewing, and all this propaganda is a sign, to me. We are so on the point of a knife, balancing, waving our arms really fast, trying to stay upright...

http://theautomaticearth.com/Finance/whats-more-important-to-you-italy-or-the-dow.html
JI
jimkane
Rep: 3,058
Posts: 33,089
For those that care, here's an article from last year on energy that I think is likely much more accurate.

http://theautomaticearth.com/Energy/unconventional-oil-is-not-a-game-changer.html
JI
jimkane
Rep: 3,058
Posts: 33,089
Oops, on that first chart I posted, there is an unlabeled line in the key area. That is a very basic, very obvious line from some 'proprietary' work that I show mentor students under the non-disclosure agreement, and I don't want to post that in here. Sorry. But I showed that because it does come right into that area. All-in-all, though, the thing I notice perhaps the most is how there isn't a lot of great confluencing anywhere from here on up, really at all. And that surprises me. I don't know what to make of that.
RA
rat89
Rep: 0
Posts: 7,015
Great thoughts Jim, thanks
JI
jimkane
Rep: 3,058
Posts: 33,089
For the first time in history, I think I'm posting more on the upcoming demise I see coming than on trading stuff. Right now I'm just a thorn in everyone's side. Some day I suspect everyone will look back at ol' Crazy Jim and say 'Now I know what Jim meant when he said "If you bet the sun is going to blow up and it does, what do you win???" '

http://www.verifythecpi.com/2013/03/february-2013-cpi-report.html